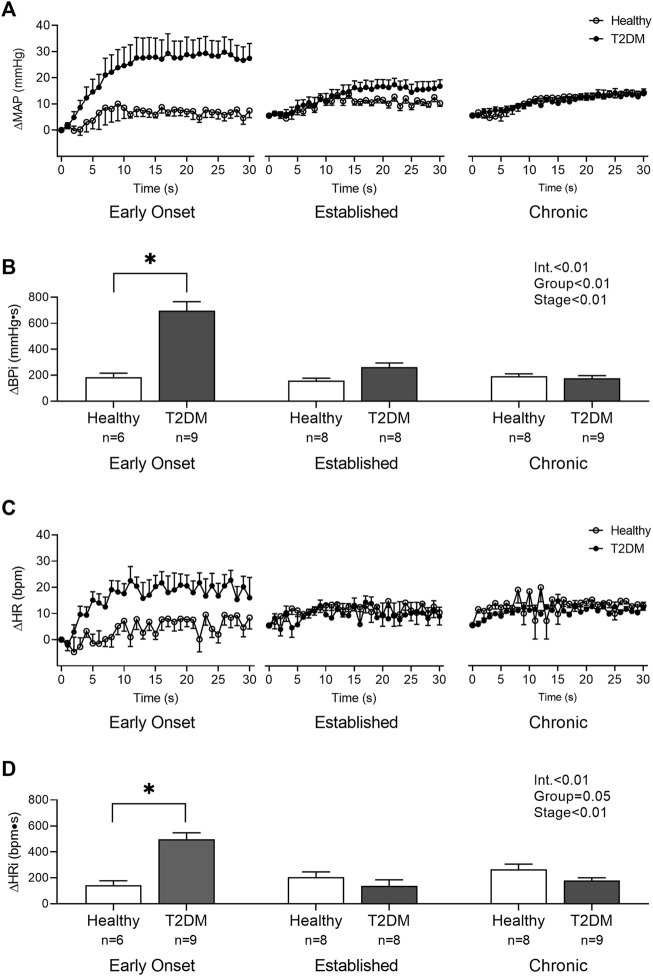
FIGURE 6.
The change in MAP (A) and HR (C) from baseline were averaged second by second to show the temporal changes during 30 s of tendon stretch in male T2DM rats and healthy, age-matched controls. ΔBPi (B) and ΔHRi (D) were then calculated over the 30 s of contraction to determine the difference between T2DM rats and healthy, age-matched controls at all stages. The ΔBPi and ΔHRi were greater in the T2DM rats compared to healthy, age-matched controls during the early onset stage of T2DM. Two-way ANOVA with Holm-Sidak’s post hoc comparisons (*) p < 0.05 indicates significant increase relative to age-matched control.

