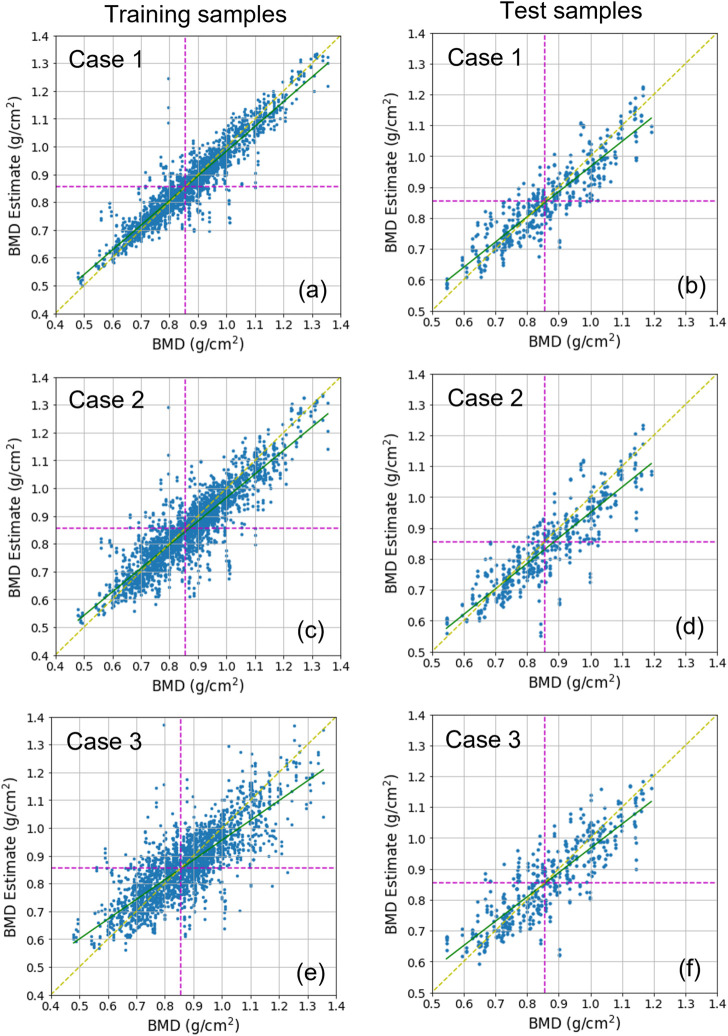
FIGURE 5.
Scatter plots displaying BMD estimates over references. (A,C,E) show the training results, and (B,D,F) show the test results. (A,B) show Case 1 results, (C,D) show Case 2 results, and (E,F) show Case 3 results. In every plot, the green line is the line of the best fit for samples. The yellow dotted diagonal line denotes the ideal reference line for checking the skewness of the fitted line. The dotted horizontal and vertical line denotes the decision boundary for classifying bone diseases. The boundary value corresponds to .856 as a BMD and −1.0 as a T-score.

