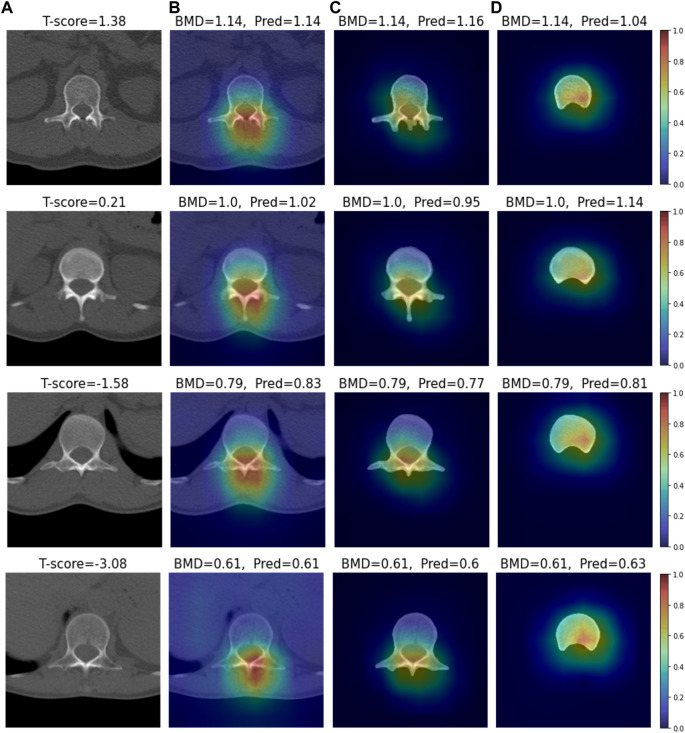
FIGURE 7.
Visual XAI results (4 test samples) using Grad-RAM. The results of every sample are represented by every row. Every row, (A) represents the cropped CT image. A T-score value is placed at the top of every image. (B–D) display the heat map superimposed on the cropped image or bone-segmented image. (B–D) show Grad-RAMP results in Case 1, Case 2 and Case 3, respectively. “BMD” and “Pred” placed at the top of every image denote the reference and predicted values, respectively.

