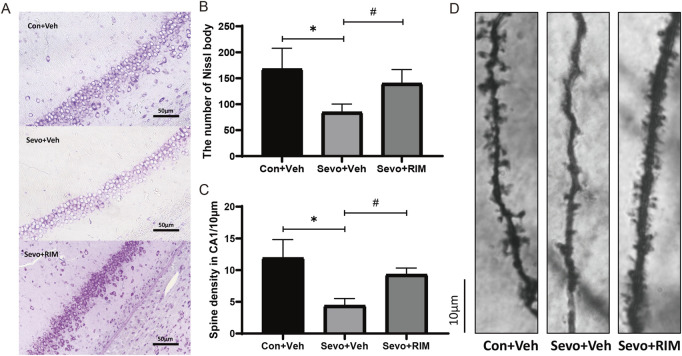
FIGURE 3.
Functions of maternal sevoflurane exposure in neuronal density and dendritic spine density in the hippocampal CA1 area of neonatal rats. Nissl staining under ×400 (A) and neuronal density ratio changes (B) in each group (n = 3). Golgi staining under ×1000 (D) and histograms of spine density/10 µm (C) in each group (n = 3). Data are displayed as mean ± S.E.M. **p < .01, vs. the Con + Veh group; #p < .05, ###p < .001, vs. the Sevo + Veh group.

