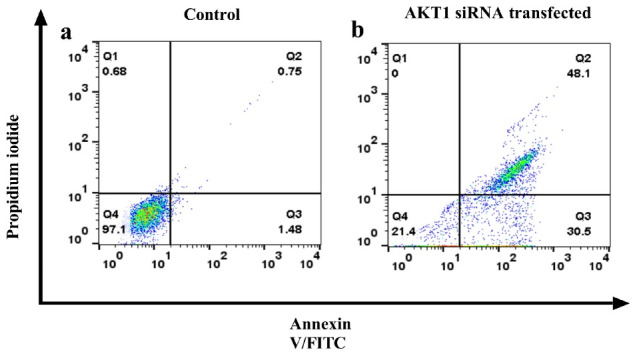
Figure 4.

Flow-cytometry analysis of treated Akt1 siRNA and the control group. The panels are shown in the following order: (a) control group; (b) Akt1 siRNA treated group. Dots with Annexin V−/PI + (Q1), Annexin V + /PI + (Q2), Annexin V + /PI− (Q3), and Annexin V−/PI− (Q4) and features represent necrotically, late apoptotic, early apoptotic, and viable intact cells, respectively
