Figure 6.

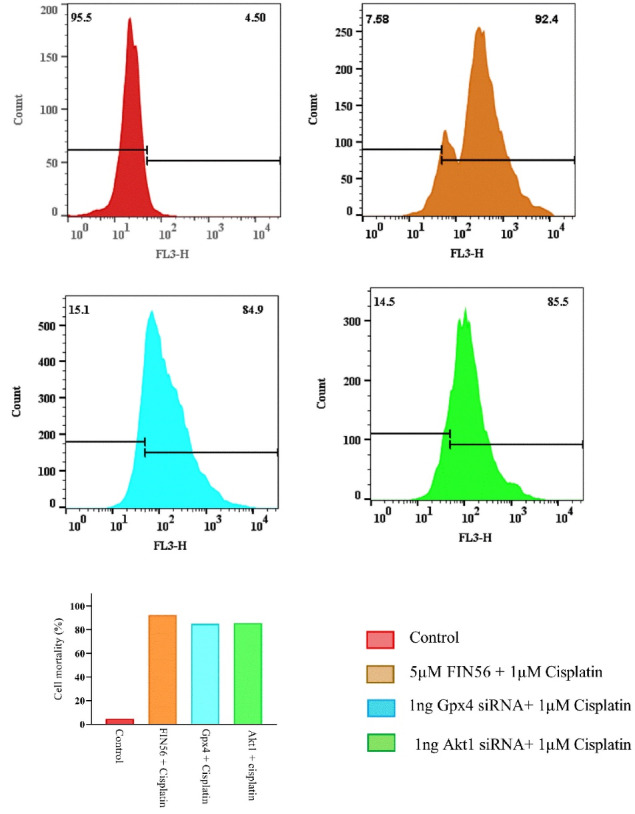
Histogram analysis of the trypan blue exclusion assay by flow-cytometry to evaluate cells’ mortality after treating by 5μM FIN56 + Cisplatin, 1 ng Akt1 siRNA + Cisplatin, 1 ng Gpx4 siRNA + cisplatin compared with the control group

Histogram analysis of the trypan blue exclusion assay by flow-cytometry to evaluate cells’ mortality after treating by 5μM FIN56 + Cisplatin, 1 ng Akt1 siRNA + Cisplatin, 1 ng Gpx4 siRNA + cisplatin compared with the control group