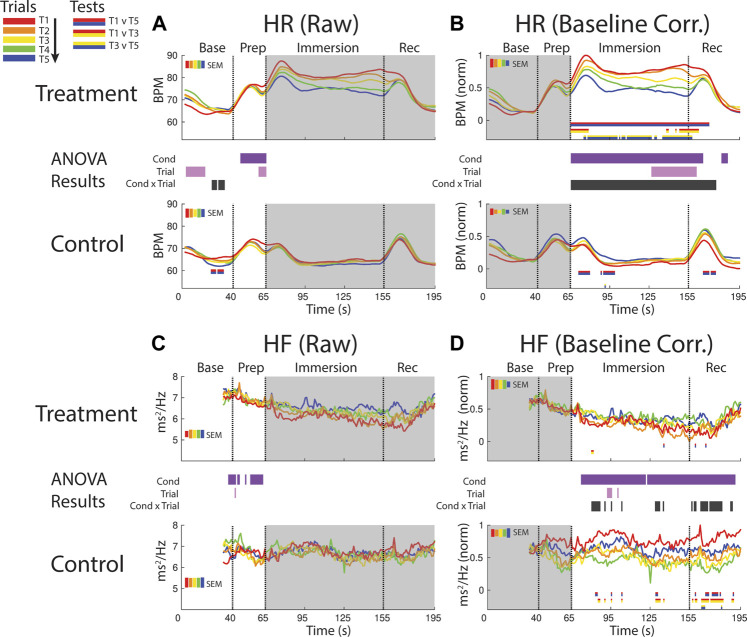
FIGURE 4.
Effects of treatment and repeated trial exposure on heartbeat rate [HR; (A,B)] and high frequency HR variability [HF; (C,D)]. Pre-exposure and evoked stress effects are reflected in raw (left column) and baseline corrected/normalized (right column) plots, respectively. Each panel contains a separate plot for the treatment and control condition, with the mean response across participants in each repetition trial (T1-T5) represented in each plot by a different color (ROYGB). Horizontal lines positioned between treatment and control plots indicate statistically significant ANOVA main effects of condition (dark purple), trial (light purple) and the condition x trial interaction (dark gray) at designated timepoints (p null<0.05). Horizontal red/blue, red/yellow and yellow/blue lines at the base of treatment and control plots respectively indicate statistically significant pairwise comparison results for T1 v T5, T1 v T3 and T3 v T5 at the designated timepoints (p null<0.05). Post-immersion raw data and pre-immersion baseline corrected normalized data are greyed out as these periods are not relevant to the pre-exposure/evoked stress analyses. The set of five vertical error bars labelled SEM on each plot represent ±SEM of the data averaged over the time-course of interest.

