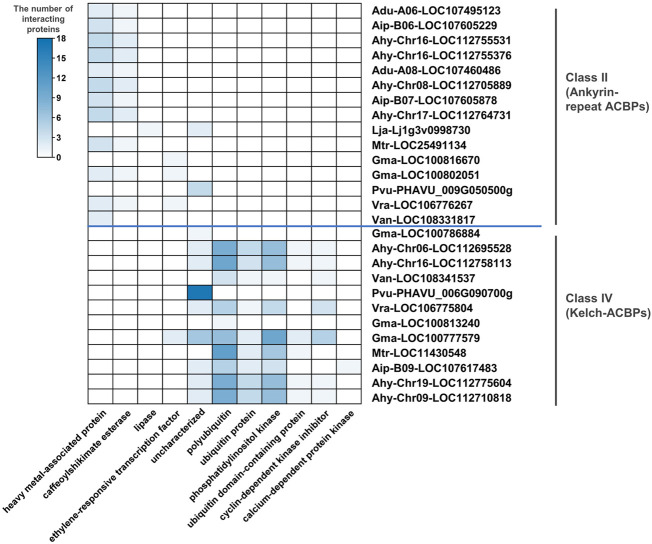
FIGURE 5.
The protein types interacting with legume ACBPs. The heat map was generated from the number of different proteins interacting with legume ACBPs. The color scale bar ranging from white to blue represents an increase in the number of interacting proteins. No interacting proteins predicted for ACBPs of class I and class III.

