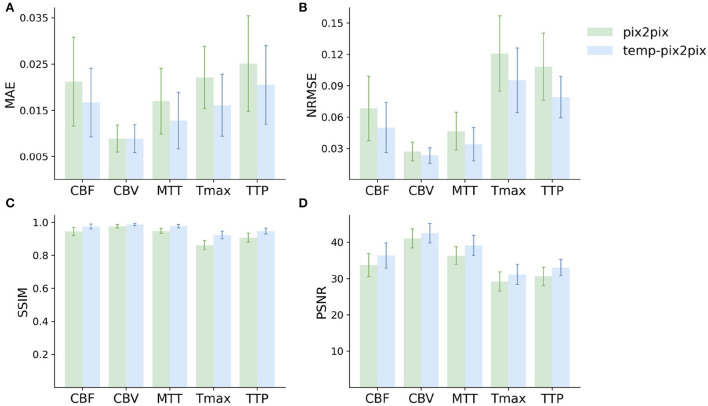
Figure 5.
Mean performance metrics for evaluating the similarity between the ground truth and the synthesized parameter maps generated by the pix2pix GAN (green) and the temp-pxi2pix GAN (blue) on the acute stroke dataset. (A, B) Show the mean absolute error (MAE) and normalized mean root squared error (NRMSE), respectively (the lower, the better). (C, D) Show the structural similarity index measure (SSIM) and the peak-signal-to-noise-ratio (PSNR) (the higher, the better). For all parameter maps, the temp-pix2pix architecture shows a better or comparable performance compared with the pix2pix GAN. For the time-dependent parameter maps such as Tmax and TTP, the difference between the pix2pix and temp-pix2pix GAN performance is larger than the other three maps. The error bar represents the standard deviation.

