
FIGURE 3.
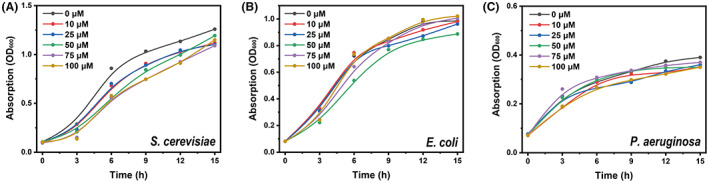
Toxicity analysis of the fluorescent probe during microbial growth. (A) Growth curves of S. cerevisiae (A), E. coli (B) and P. aeruginosa (C) with 0, 10, 25, 50, 75, 100 μM fluorescent probes show no significant inhibition of the growth.
Official websites use .gov
A
.gov website belongs to an official
government organization in the United States.
Secure .gov websites use HTTPS
A lock (
) or https:// means you've safely
connected to the .gov website. Share sensitive
information only on official, secure websites.
Toxicity analysis of the fluorescent probe during microbial growth. (A) Growth curves of S. cerevisiae (A), E. coli (B) and P. aeruginosa (C) with 0, 10, 25, 50, 75, 100 μM fluorescent probes show no significant inhibition of the growth.