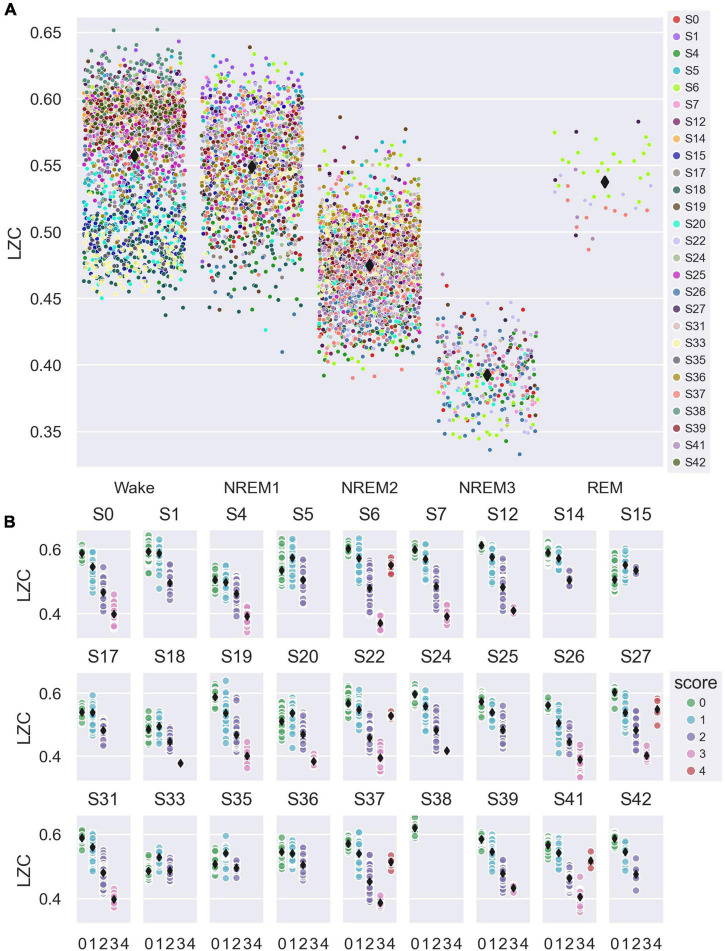
FIGURE 3.
Variation in whole-brain average single-channel Lempel-Ziv complexity (LZC) with sleep stage. (A) Average single-channel LZC vs. sleep stage for the whole-brain channel selection (all channels, see Figure 2A). Each data point corresponds to one 30 s sleep epoch. Observations are randomly scattered along the x-axis to reduce overlap, and participant number is indicated by marker fill color. Overall mean values for each sleep stage are indicated by black diamond markers. (B) Whole-brain average single-channel LZC vs. sleep stage (0 = W, 1 = NREM1, 2 = NREM2, 3 = NREM3, 4 = REM), plotted separately for each study participant. Each data point corresponds to one 30 s sleep epoch. Fill color indicates sleep stage, and black diamond markers indicate participant mean values for each stage.

