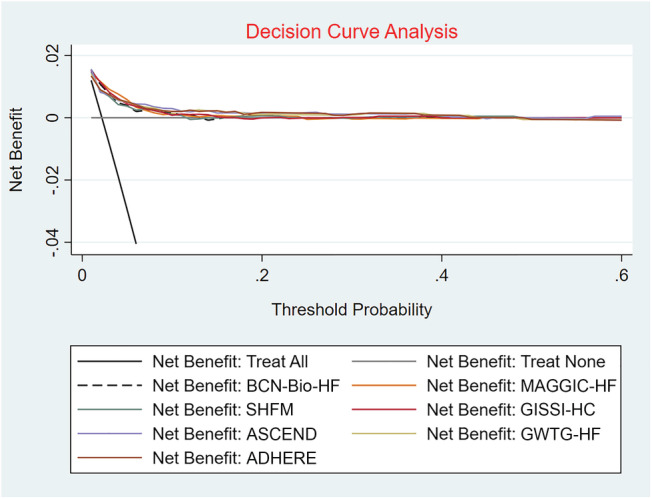
Figure 2.

Decision curve analysis for risk scores in the validation cohort. The y‐axis measures the net benefit. The grey solid line represents the assumption that all patients are complicated with no risk. The black solid line represents the assumption that all patients are complicated with dead. The black dotted lines and other coloured lines represent the risk scores, showing that if the threshold probability of a patient is between 1% and 12%, using this prediction scores in the current study superior to the ‘intervention‐for‐none’ scheme. ADHERE, the Acute Decompensated Heart Failure National Registry model; ASCEND, Acute Study of Clinical Effectiveness of Nesiritide in Decompensated Heart Failure risk scores; BCN‐Bio‐HF, Barcelona Bio‐Heart Failure risk calculator; GISSI‐HF, Gruppo Italiano per lo Studio della Streptochinasi nell'Infarto Miocardico‐Heart Failure; GWTG‐HF, Get With the Guidelines‐Heart Failure programme; MAGGIC‐HF, Meta‐Analysis Global Group in Chronic Heart Failure risk score; SHFM, Seattle Heart Failure Model.
