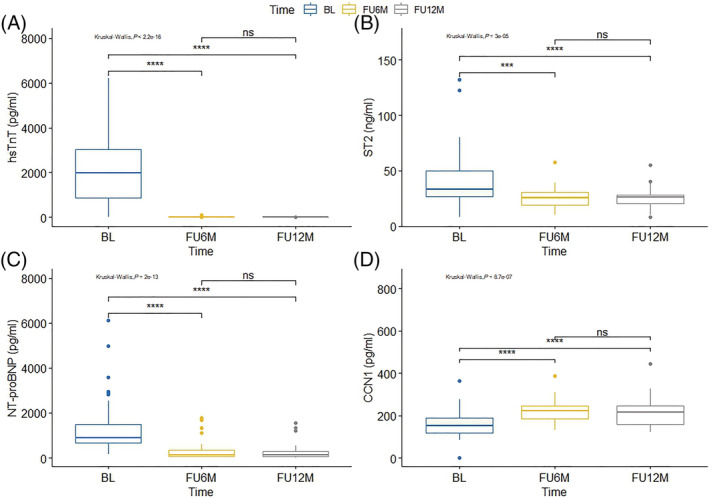
Figure 2.

Differential time course of biomarkers in the first 12 months after STEMI. Boxplot illustration showing median with the first and third quartiles. CCN1, cellular communication network factor 1; hsTnT, high‐sensitivity troponin T; NT‐proBNP, N‐terminal pro‐B‐type natriuretic peptide; ST2, suppression of tumorigenicity 2. ****P < 0.001.
