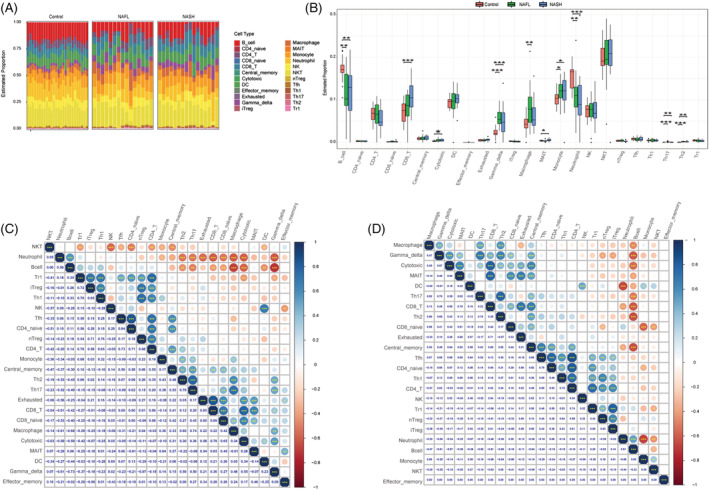
Figure 5.

Immune infiltration of non‐alcoholic fatty liver disease (NAFLD). (A) The fraction of 24 subsets of immune cells in NAFLD and control samples. (B) Bar chart of the ratio of immune cells. *P < 0.05, **P < 0.01, ***P < 0.001 vs. controls. (C) Correlation matrix of 24 immune cell subtype fractions in non‐alcoholic fatty liver (NAFL). (D) Correlation matrix of 24 immune cell subtype fractions in non‐alcoholic steatohepatitis (NASH).
