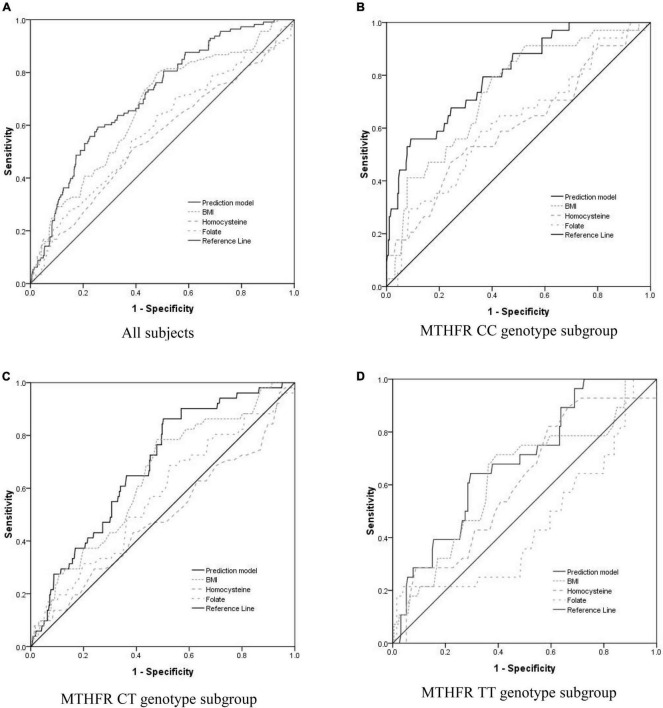
FIGURE 1.
Evaluate the accuracy of the PIH prediction model including BMI and serum concentration of folate and homocysteine using receiver operating characteristic (ROC) curve analysis. (A) For All of the subjects, the area under the curve (AUC) of the prediction model, BMI, serum homocysteine concentration, and serum folate concentration was 0.711 (95% CI = 0.663–0.758, p < 0.0001), 0.664 (95% CI = 0.611–0.716, p < 0.0001), 0.554 (95% CI = 0.494–0.615, p = 0.059), and 0.580 (95% CI = 0.521–0.639, p = 0.006), respectively. (B) For the subgroup of subjects with MTHFR CC genotype, the AUC of the prediction model, BMI, serum homocysteine concentration, and serum folate concentration was 0.802 (95% CI = 0.725–0.878, p < 0.0001), 0.737 (95% CI = 0.652–0.821, p < 0.0001), 0.606 (95% CI = 0.498–0.713, p = 0.044), and 0.617 (95% CI = 0.513–0.720, p = 0.026), respectively. (C) For the subgroup of subjects with MTHFR CT genotype, the AUC of the prediction model, BMI, serum homocysteine concentration, and serum folate concentration was 0.684 (95% CI = 0.615–0.754, p < 0.0001), 0.638 (95% CI = 0.562–0.715, p = 0.001), 0.489 (95% CI = 0.398–0.579, p = 0.792), and 0.565 (95% CI = 0.479–0.651, p = 0.127), respectively. (D) For the subgroup of subjects with MTHFR TT genotype, the AUC of the prediction model, BMI, serum homocysteine concentration, and serum folate concentration was 0.685 (95% CI = 0.587–0.783, p = 0.002), 0.628 (95% CI = 0.514–0.742, p = 0.001), 0.609 (95% CI = 0.500–0.717, p = 0.063), and 0.449 (95% CI = 0.326–0.651, p = 0.573), respectively.

