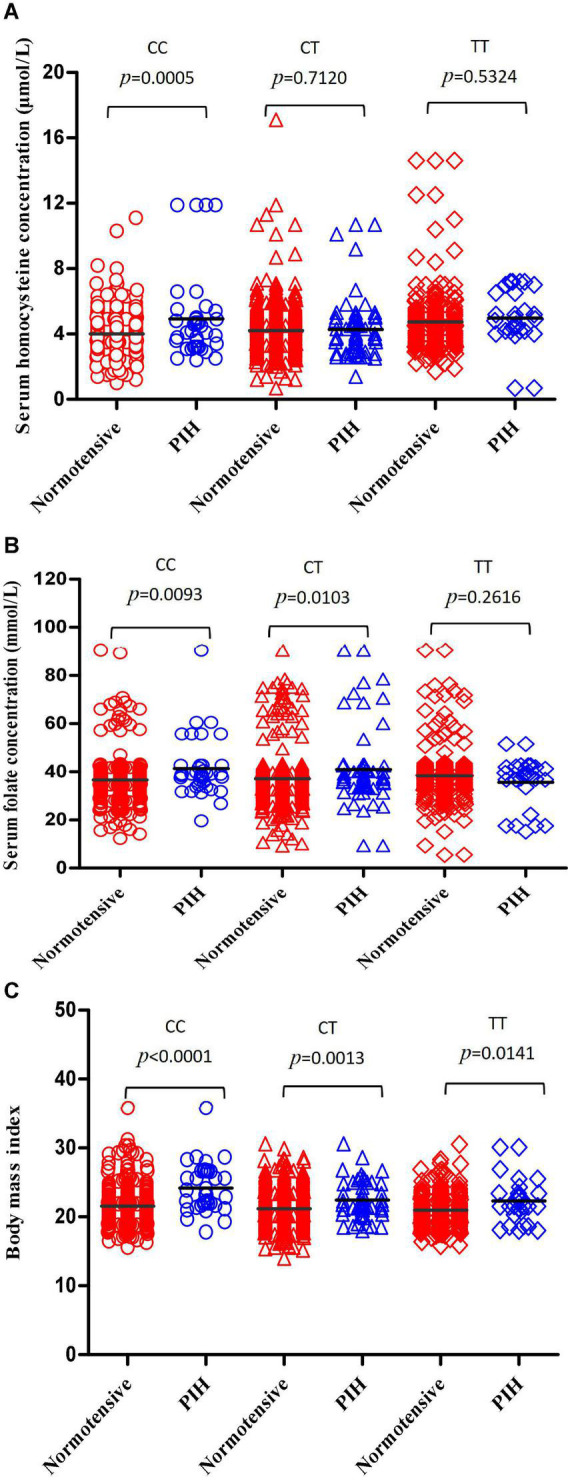
FIGURE 3.

Compare the differences in serum homocysteine concentration, serum concentration, and BMI between the normotensive pregnancy group and PIH group in subgroups carrying different MTHFR C677T genotypes. (A) Compare the differences in serum homocysteine concentration between the normotensive pregnancy group and PIH group in subgroups carrying different MTHFR CC, CT, and TT genotypes, respectively. (B) Compare the differences in serum folate concentration between the normotensive pregnancy group and PIH group in subgroups carrying different MTHFR CC, CT, and TT genotypes, respectively. (C) Compare the differences in BMI between the normotensive pregnancy group and PIH group in subgroups carrying different MTHFR CC, CT, and TT genotype, respectively.
