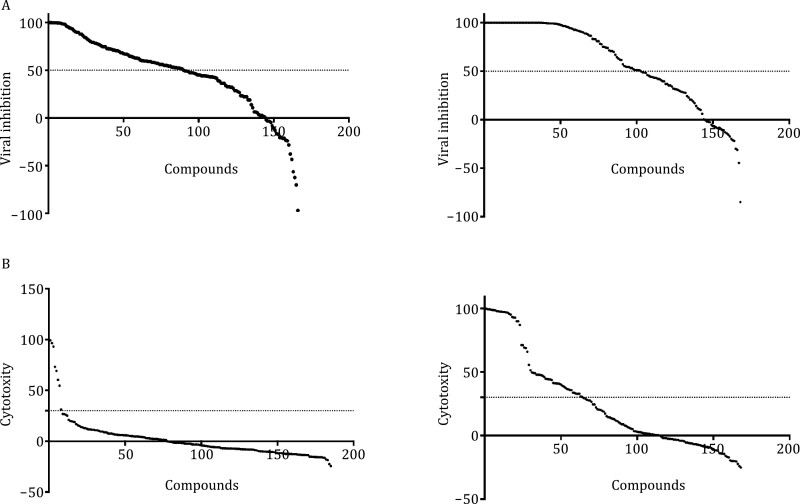
Figure 3.
Distribution of virus replication inhibition and cytotoxicity. (A) The inhibition of selected Mpro inhibitors (left panel) and PLpro (right panel) on viral replication. (B) The cytotoxicity distribution of selected Mpro inhibitors (left panel) and PLpro (right panel) on viral replication. Note that the compound order between (A) and (B) is different.

