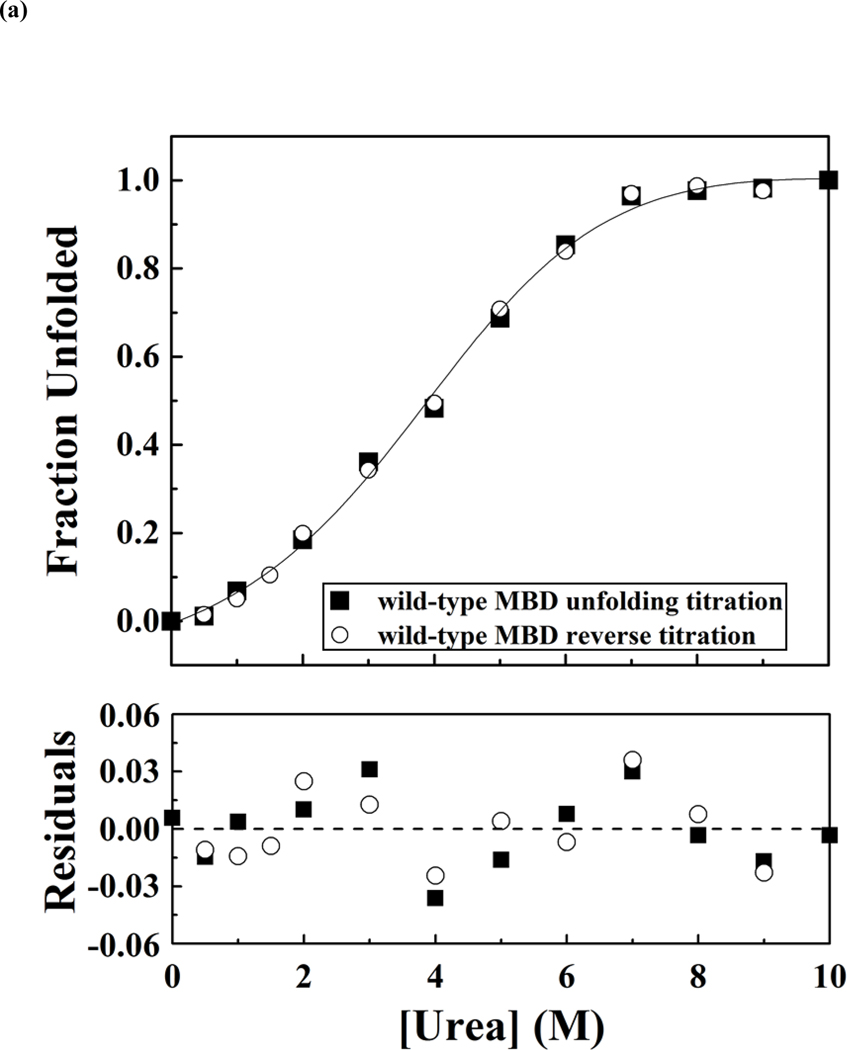
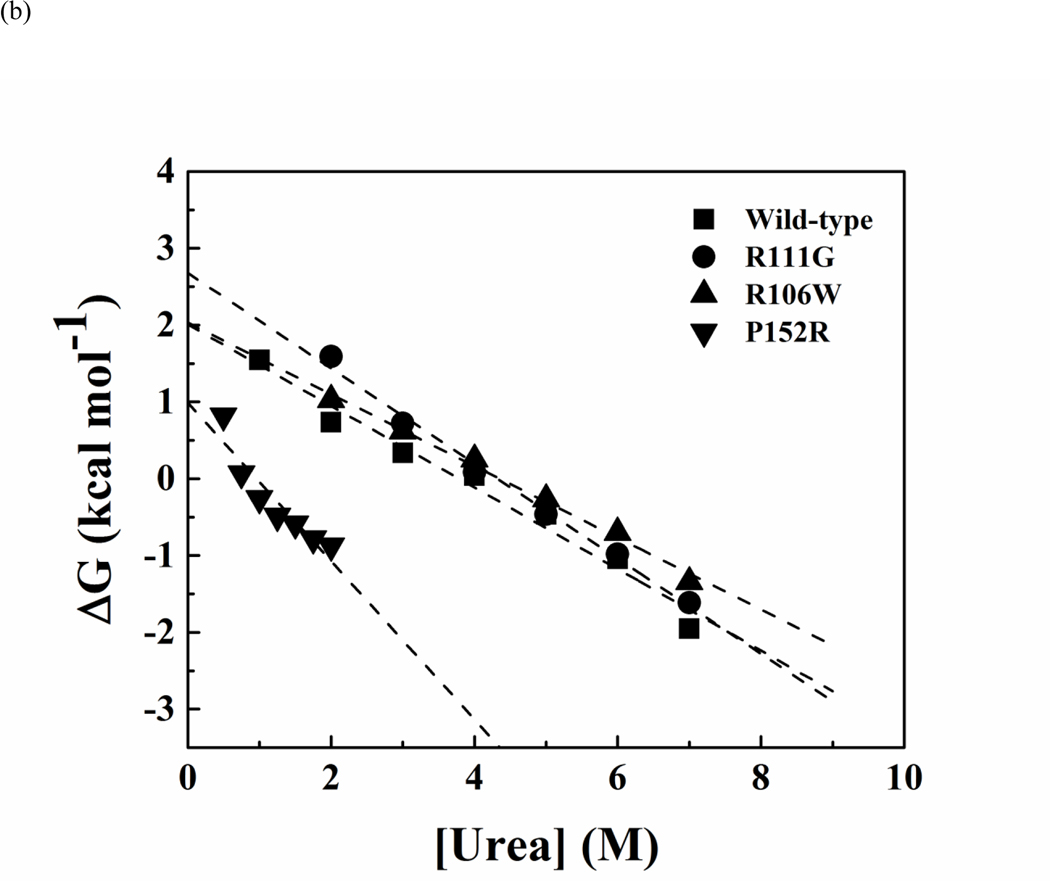
Figure 4.
Representative curves of urea-induced denaturation of the wild-type and mutant MBD proteins monitored by CD.(a). Native MBDs (closed square) or urea-unfold MBDs (open circle) were diluted to indicated concentration of urea. The mean residue ellipticity at 222 nm was converted from buffer-subtracted CD signals at 222 nm and was used to calculate unfolded fraction accordingly to equation 3. The solid line represents a nonlinear fit of unfolding and refolding data to a two-state transition. The residues for the fit are shown below. (b) Representative free-energy change of MBDs at indicated concentration of urea, The dash lines represent linear extrapolation method to obtain the free-energy change in the absence of urea (64).


