
Figure 2.
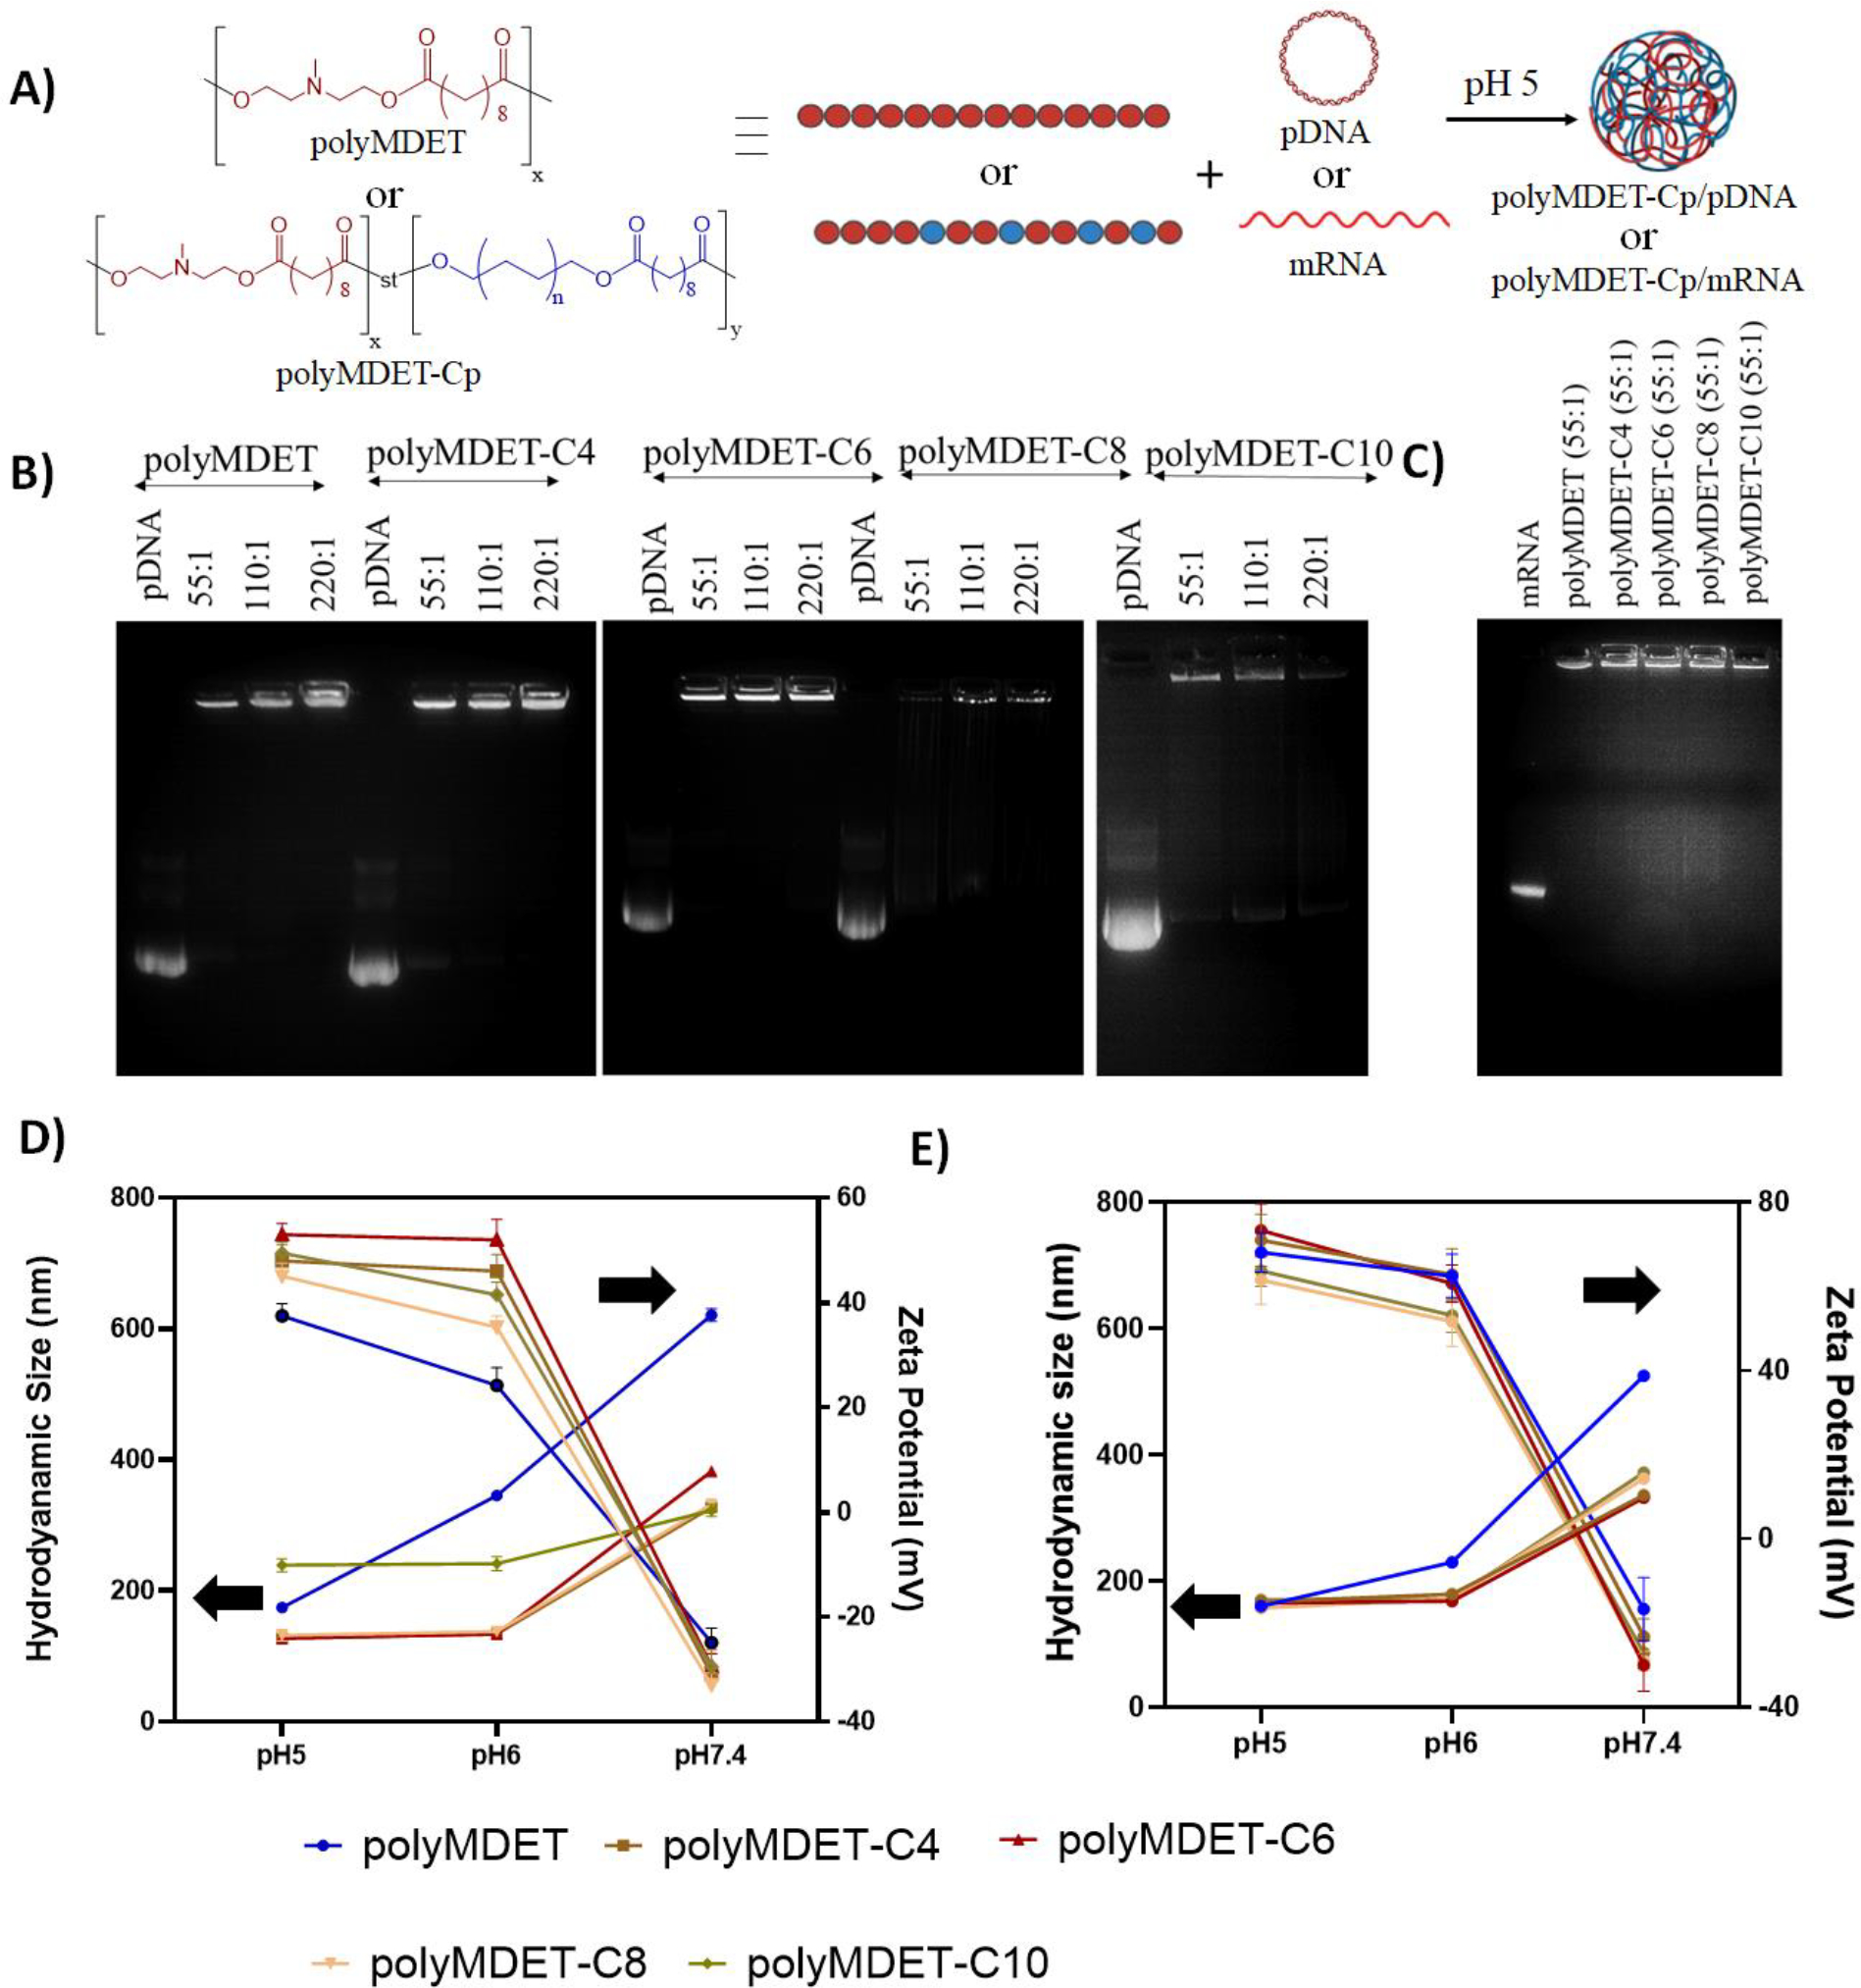
Polyplex preparation and characterization. (A) Schematic representation of the polyplex preparation with polymers and pDNA or mRNA. (B) Agarose gel electrophoresis showing the stability of polyplexes made with various polymers and pDNA at different weight ratios (55:1, 110:1, and 220:1). (C) Agarose gel electrophoresis showing the stability of polyplexes prepared using various polymers and mRNA at 55:1 weight ratio. Hydrodynamic size and zeta potential of polyplexes prepared with (D) pDNA and (E) mRNA, respectively. Data are representative of n=3 experiments. Errors bars represent standard deviation. Left arrow indicates the hydrodynamic diameter of the polyplexes, whereas the right arrow indicates the zeta potential.