
Figure 4.
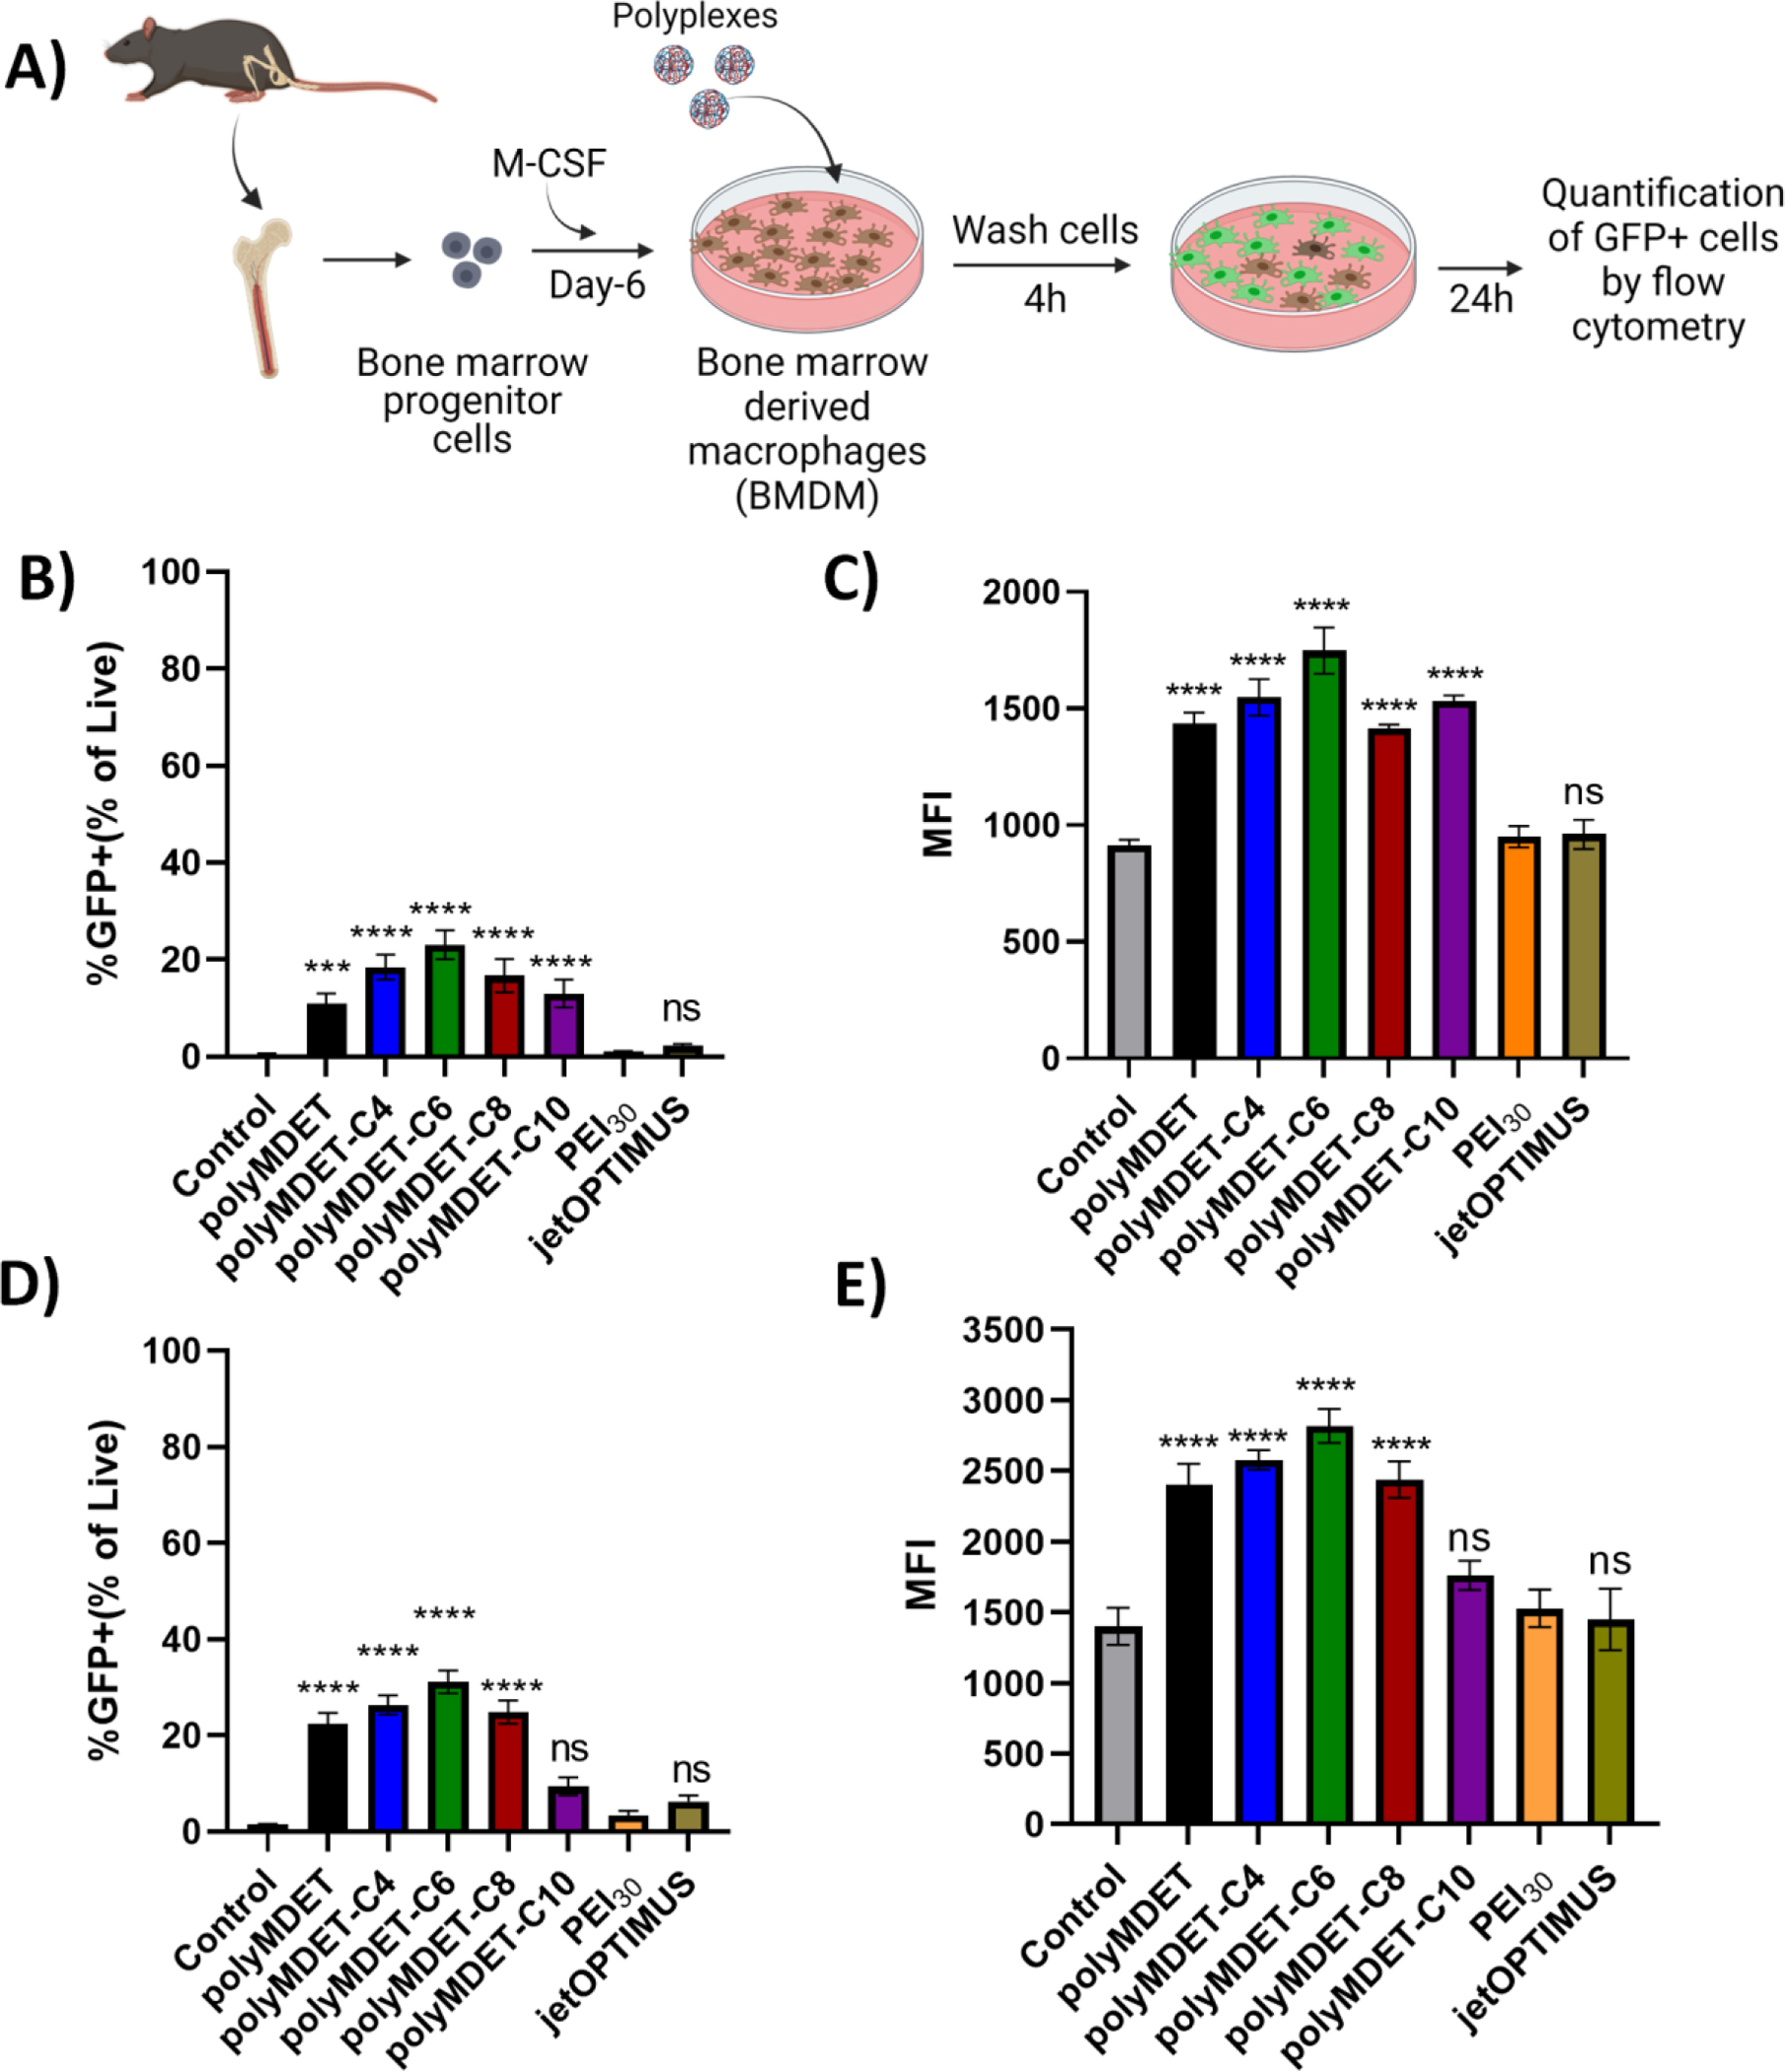
Flow cytometry-based quantification of transfection efficiency of polyMDET and polyMDET-Cp polyplexes in primary BMDM cells. (A) Representative schematic for extraction of bone marrow from the femur and tibia of C57BL/6 mouse, differentiation into bone marrow-derived macrophages (BMDM), and polyplex treatment. Created with BioRender. (B and D) Flow cytometry-based quantification of transfection efficiency of polyMDET/pDNA, polyMDET-Cp/pDNA and polyMDET/mRNA, polyMDET/mRNA polyplexes, respectively, in BMDMs. (C and E) Mean fluorescence intensity (MFI) of GFP expression after transfection of GFP encoded pDNA and mRNA, respectively. The amount of GFP pDNA and GFP mRNA used was 2 μg and 1 μg, respectively per 2 × 10⁵ BMDMs. PEI30 corresponds to polyplexes prepared at N/P ratio 30. Data are representative of n=3 experiments. Statistical differences between groups were determined by performing a one-way ANOVA and Tukey’s post-hoc test (***P<0.001 ****P<0.0001). Errors bars represent standard deviation.