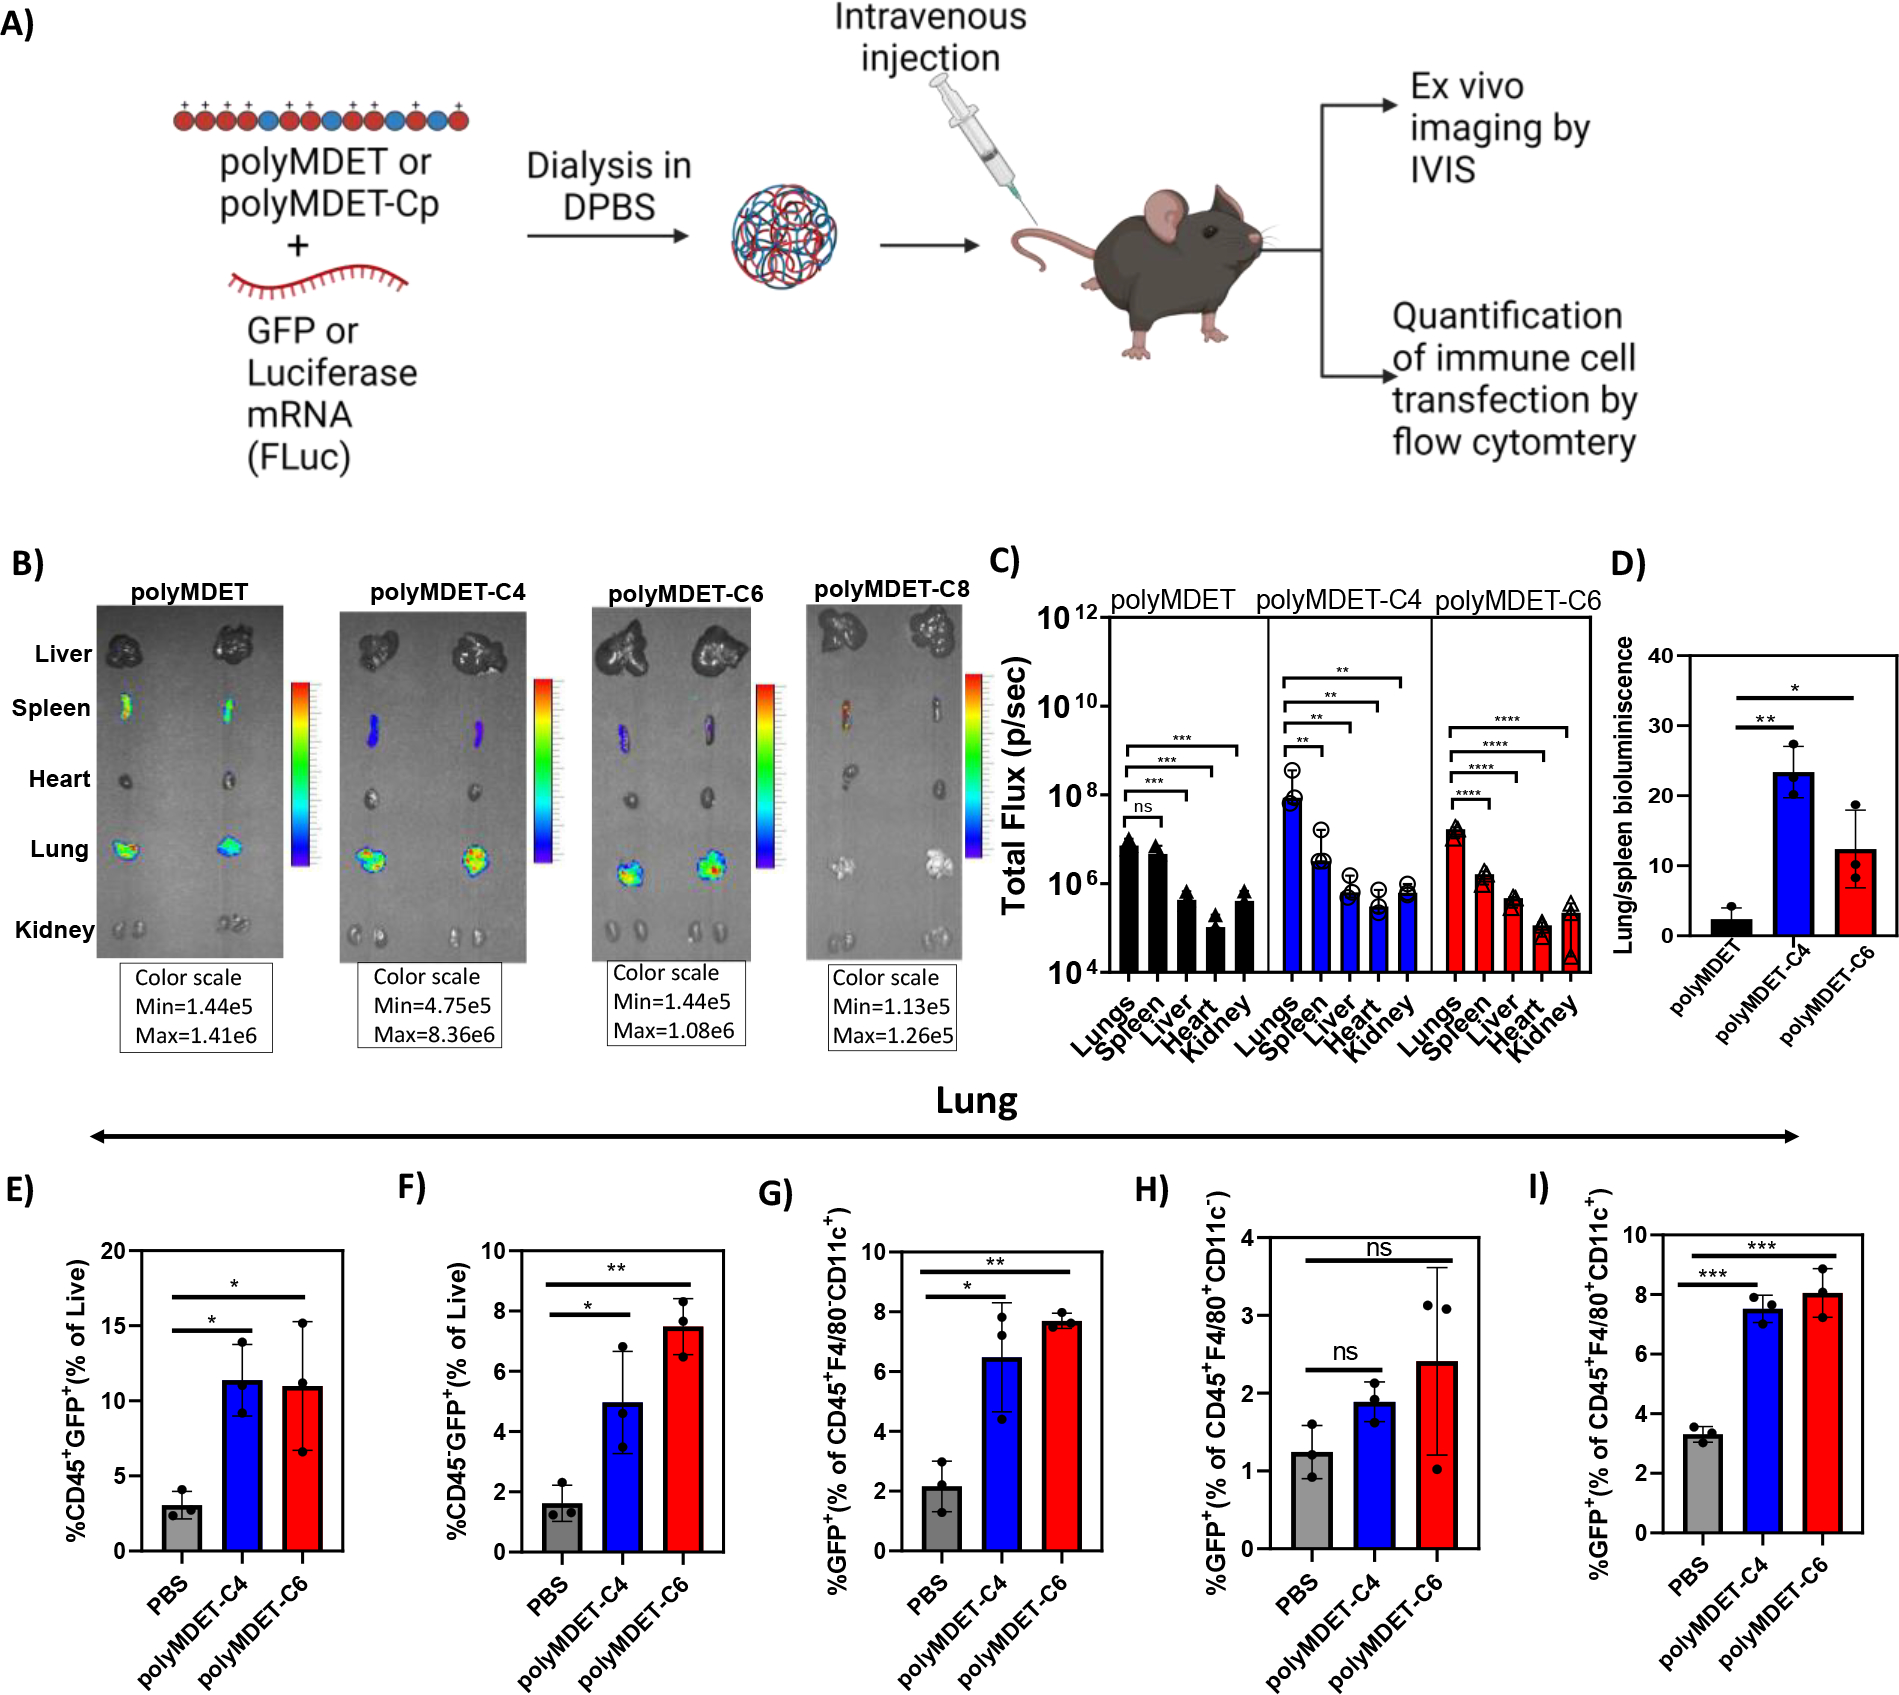
Figure 6.

In vivo mRNA transfection in C57BL/6 mice and quantification of immune cell transfection. (A) Schematic for mRNA polyplex preparation, in vivo administration, and analysis of cell transfection. (B) Representative ex vivo bioluminescence images of organs after 24 h of intravenously injected FLuc-encoded mRNA polyplexes in C57BL/6 mice. (C) Quantification of FLuc mRNA expression in selected tissues. (D) Relative bioluminescence intensity of lung compared to spleen in PolyMDET, PolyMDET-C4, and PolyMDET-C6. Flow cytometric analysis in the lung of (E) total percentage of CD45+GFP+ cells. (F) total percentage of CD45−GFP+ cells. (G) total percentage of CD45+F4/80−CD11c+GFP+. (H) total percentage of CD45+F4/80+CD11c−GFP+ (I) CD45+F4/80+CD11c+ cells in lungs. Statistical differences between groups were determined by performing a one-way ANOVA and Turkey’s post-hoc test (*P<0.05, **P<0.01, ***P<0.001 ****P<0.0001). Errors bars represent standard deviation. N=3 mice per experimental group.
