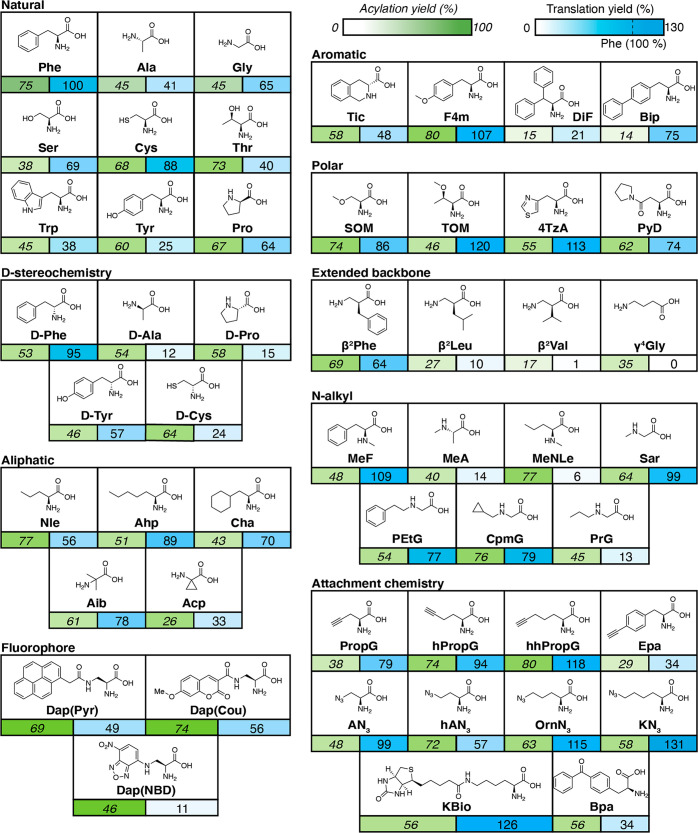
Figure 3.
Acylation and translation efficiencies for all elongation amino acids tested in the P3 sequence context. Reported acylation yields (percentage, green) were calculated based on the relative band intensities of aminoacyl-NCAA-microhelix RNA [MH+aa] and microhelix RNA [MH], presented as [MH+aa]/([MH+aa] + [MH]). Translation yields (percentage, blue) are normalized to translation of Phe in the P3 peptide context with a nonacylated control subtracted. Full names and acylation conditions for all amino acids are listed in Table S1.

