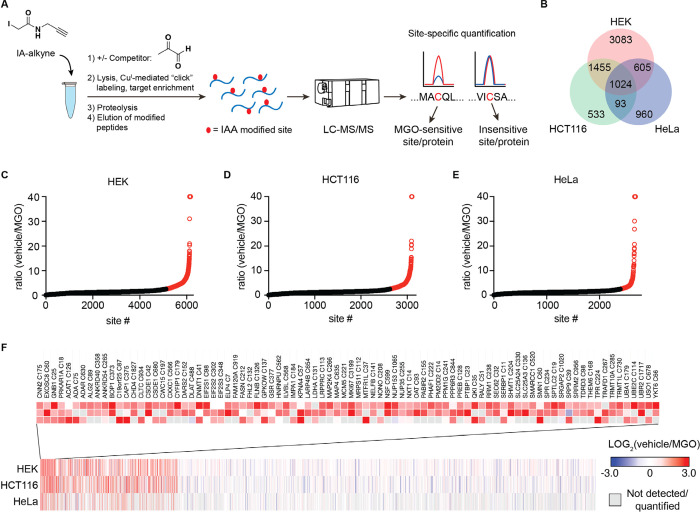
Figure 2.
Proteome-wide profiling of MGO-IA-alkyne competition at functional cysteines. (A) Workflow of IA-alkyne SILAC LC–MS/MS profiling experiments to quantify MGO regulation of cysteine residues in a proteome-wide manner. (B) Venn diagram of unique, quantified cysteine residues in lysates from HEK293, HCT116, and HeLa cancer cells. (C–E) Waterfall plots of IA-alkyne-labeled cysteine residue SILAC ratios for HEK293 (C), HCT116 (D), and HeLa (E) lysates treated for 2 h with 1 mM MGO or vehicle at 37 °C. Data points shown are mean SILAC ratio derived from n = 4 biological replicates each. (F) Heatmap of the ratios of all unique sites quantified in lysates from multiple cell lines in IA-alkyne SILAC proteomic profiling experiments. Sites that showed a SILAC ratio of vehicle over MGO treated >2.5 in more than one cell line are highlighted. Gray boxes denote no data for that site/condition pair.

