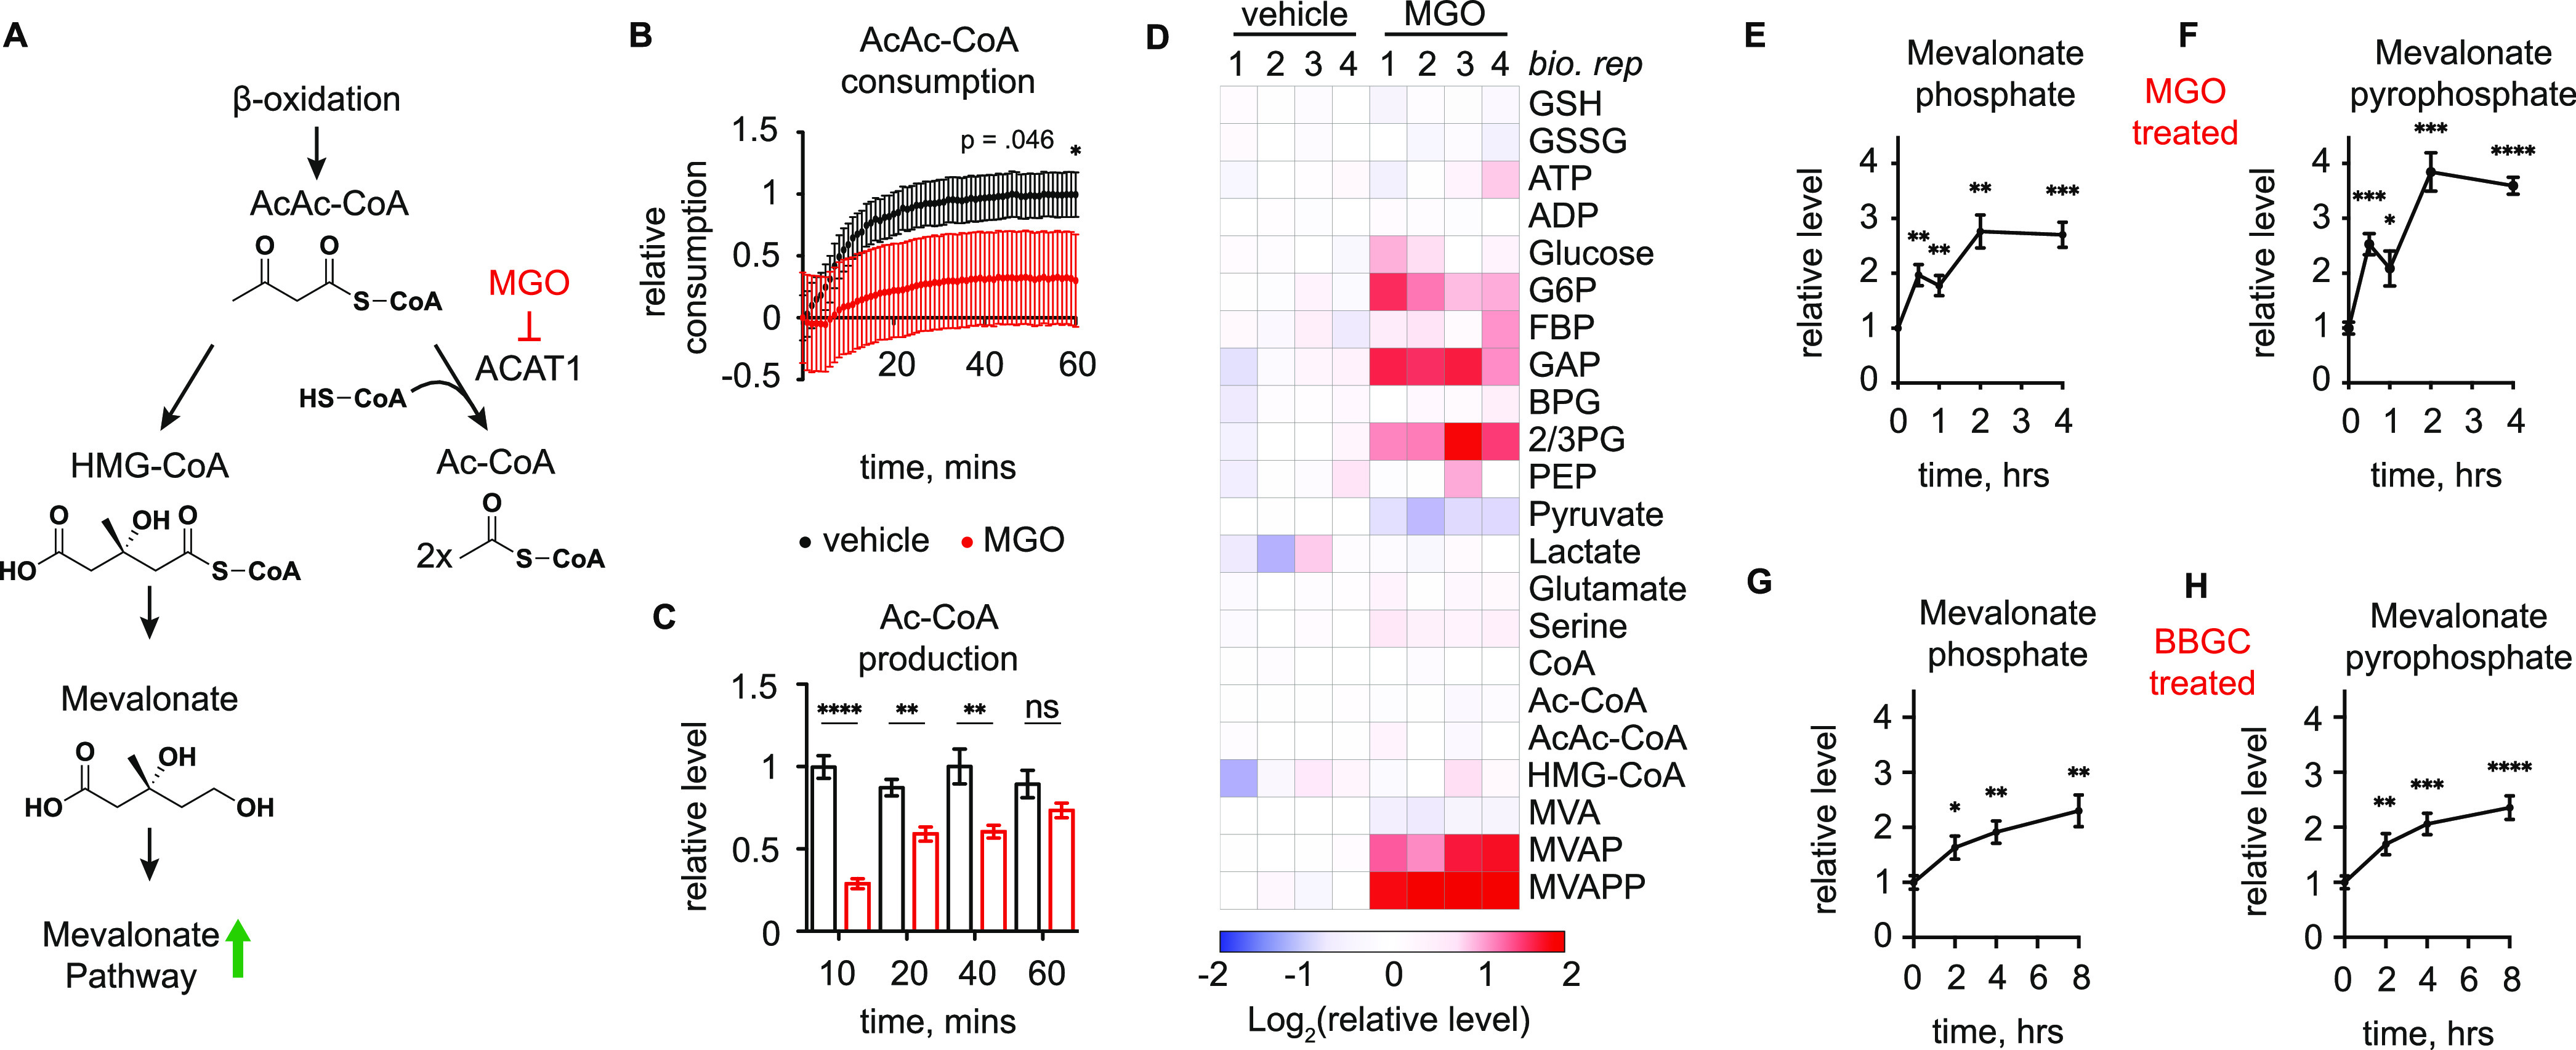
Figure 4.

Methylglyoxal modification regulates ACAT1 activity. (A) Connections between ACAT1 and mevalonate pathway, as well as a proposed model of mevalonate pathway metabolite accumulation as a result of MGO inhibition of ACAT1 activity. (B) Relative consumption of AcAc-CoA by recombinant ACAT1 treated with 2 mM MGO (red) or vehicle (black). (C) LC–MS quantification of Ac-CoA produced by recombinant ACAT1 within time course studies after pretreatment with 2 mM MGO or vehicle. (D) LC–MS quantification of indicated metabolites in HeLa cells treated with MGO (2 mM) or vehicle for 4 h. (E,F) LC–MS quantification of mevalonate-5-phosphate (E) and mevalonate-5-pyrophosphate (F) in HeLa cells treated with MGO (2 mM) at the indicated time points. (G,H) LC–MS quantification of mevalonate-5-phosphate (G) and mevalonate-5-pyrophosphate (H) in HeLa cells treated with GLO1 inhibitor BBGC (20 μM) at the indicated time points. Data are mean ± S.E.M. from n = 8 (B,G,H) or 4 (C,E,F) independent biological replicates. Statistical analysis in B and C is by one-sided unpaired Student’s t-test. Statistical analysis in E–H is by two-sided unpaired Student’s t-test comparing individual timepoints to their corresponding 0-h control. *p < 0.05; **p < 0.01; ***p < 0.001; and ****p < 0.0001.
