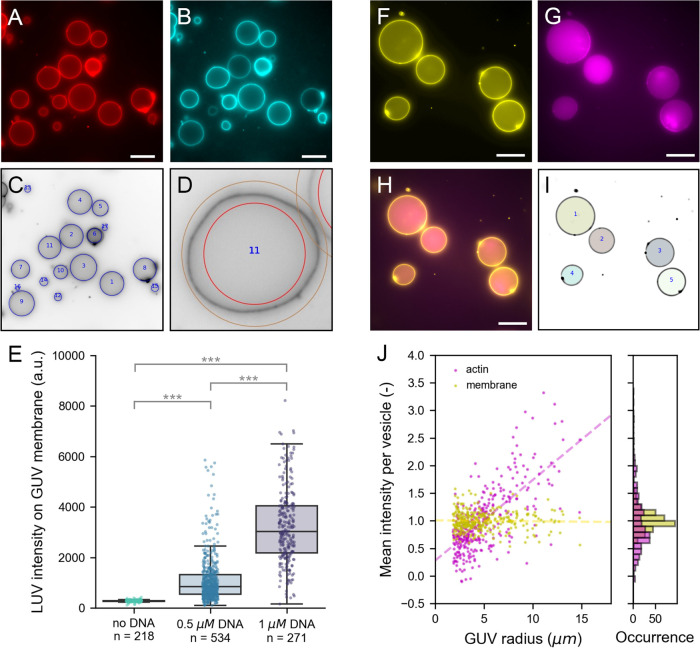
Figure 6.
Population analysis. (A–E) Analysis of LUVs binding via membrane-anchored oligonucleotides to GUV membranes. (A) Atto 488 DOPE-labeled GUVs produced by gel-assisted swelling. (B) Atto 655 DOPE-labeled LUVs localize on GUV membranes when both are incubated with 1 μM cholesterol-DNA. (C) CHT detection in the Atto488-channel (inverted contrast). Detected vesicles are indicated with blue circles. (D) Example of the detection ring of 50 pixels width used for basic membrane analysis. (E) Bar plot of LUV intensity on the GUV membrane at different DNA concentrations. Each point represents the LUV intensity on an individual vesicle; *** indicates statistically significant difference with p < 0.001. (F–J) Analysis of fluorescent monomeric actin encapsulated in GUVs using cDICE. (F) DOPC GUVs labeled with 0.1% (mol/mol) 18:1 Cy5 PE. (G) Encapsulated actin of which 10% is labeled with Alexa 488. (H) Composite image of membrane and actin. (I) Results of FF detection. Masks represent detected vesicles. (J) Mean intensity normalized by population average of actin (magenta) and membrane (yellow) plotted against the GUV radius (left) and shown in a histogram (right). Dashed lines in the scatter plot are linear regression results for actin (magenta, slope is 0.15) and membrane (yellow, slope is 0.00). All images are wide-field fluorescence images. Scale bar is 20 μm in all images.

