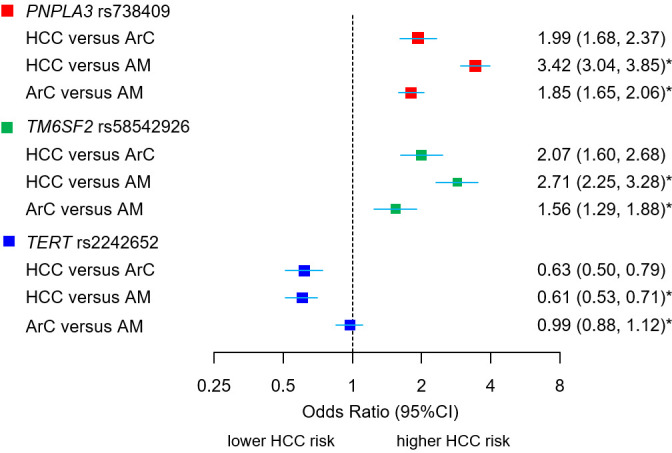
Figure 2.

Association between novel (TERT) and confirmed loci (PNPLA3, TM6SF2) with HCC and cirrhosis phenotypes. ORs and 95% CIs for the susceptibility loci for alcohol-related HCC and alcohol-related cirrhosis (ArC) in comparison to alcohol misusers without cirrhosis (AM). The comparison HCC vs ArC displays allelic ORs of combined stage 1 and 2 samples (meta-analysis), derived from allele dosage data, adjusted for age, sex, BMI, type 2 diabetes status and top 15 principal components of genetic ancestry. *The comparison HCC versus AM and ArC versus AM display unadjusted allelic ORs derived from 2×2 contingency tables of allele counts observed in the total cohort, provided in online supplemental tables 2–4. BMI, body mass index; HCC, hepatocellular carcinoma.
