Figure 3.
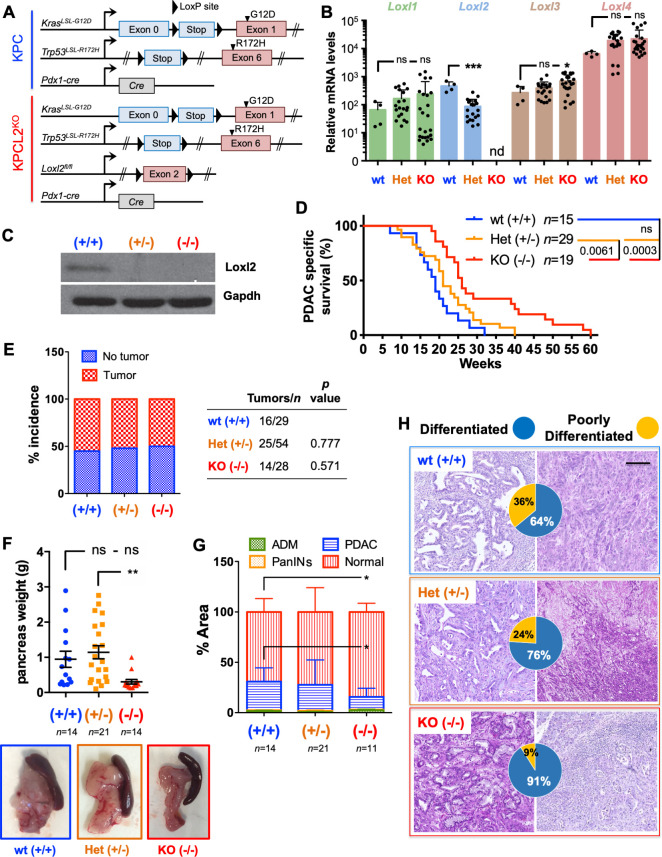
Loss of Loxl2 improves overall survival and decreases tumour burden. (A) Scheme of the genetic mouse models for pancreatic cancer. The colour code (blue, KPC wild type (wt); red, KPCL2KO) is used for all results. (B) Mean relative mRNA levels±SEM of indicated genes in tumour-derived cells from the indicated genotypes (nd, not detected; ns, not significant; *p<0.05, ***p<0.001; one-way analysis of variance (ANOVA) with Dunnett’s post-test). (C) Loxl2 expression in tumour homogenates from the indicated KPC genotypes. Gapdh, loading control. (D) Survival of wt (+/+), Het (KPC; Loxl2 +/-) and KO KPC (KPC; Loxl2 -/-) mice. All mice died of PDAC associated disease at the indicated times (p value is shown; ns, not significant; log-rank (Mantel-Cox) test). Calculated median survivals are: wt (+/+): 19 weeks; Het (KPC; Loxl2 +/-): 21 weeks; and KO KPC (KPC; Loxl2 -/-): 26 weeks. (E) Percent tumour incidence in wt (+/+), Het (KPC; Loxl2 +/-) and KO KPC (KPC; Loxl2 -/-) mice at 17–18 weeks post birth. (P values are shown, contingency analysis, two-sided Fisher’s exact test). Tumour incidence was determined as positive if a macroscopic tumour was visible on necropsy. (F) Mean pancreas weight ±SEM in wt (+/+), Het (KPC; Loxl2 +/-) and KO KPC (KPC; Loxl2 -/-) mice at 17–18 weeks post birth (left). (**P<0.01; ns, not significant; one-way ANOVA with Tukey post-test). Representative images of PDAC tumours/genotype (bottom) at 17–18 weeks post birth. (G) Quantification of tissue area in mouse pancreata from wt (+/+), Het (KPC; Loxl2 +/-) and KO KPC (KPC; Loxl2 -/-) mice at 17–18 weeks post birth, categorised as severely altered tissue (acinar-to-ductal metaplasia (ADM) and inflammation), pancreatic intraepithelial neoplasias (PanINs I–III), cancer tissue (PDAC) or normal acinar tissue (*p<0.05, contingency analysis, two-sided Fisher’s exact test). (H) Representative H&E-stained sections for the grading of the respective tumours: wt (+/+) KPC (blue, n=14), Het KPC (KPC; Loxl2 +/-) (orange, n=21) and KO KPC (KPC; Loxl2 -/-) mice (red, n=11). Pie chart insets=percent of differentiated (blue) vs poorly differentiated (yellow) tumours for each genotype. Scale bar=250 µm. Het, heterozygous; KO, knockout; Loxl2, lysyl oxidase-like protein 2; mRNA, messenger RNA; PDAC, pancreatic ductal adenocarcinoma.

