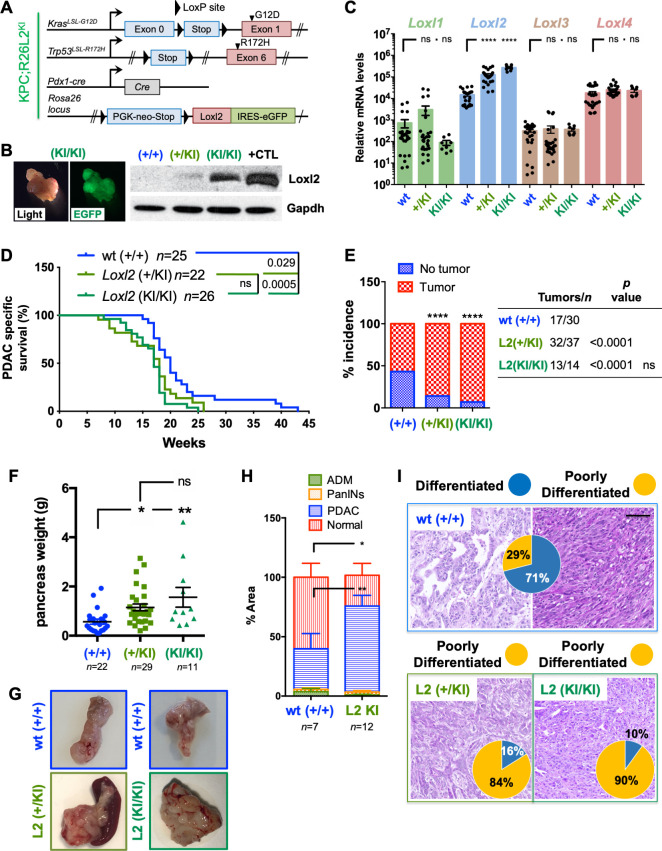
Figure 4.
Overexpression of Loxl2 worsens overall survival and increases tumour burden. (A) Scheme of the KPC-based Loxl2 overexpression genetic mouse model. The colour code green, KPCL2KI, is used for all results. (B) Light and EGFP tumour images (left). Loxl2 expression in tumour homogenates from the indicated KPC genotypes (right). Gapdh, loading control. Positive (+) control=cell lysate from murine Loxl2-overexpressing 293 T cells. (C) Mean relative mRNA levels ±SEM of indicated genes in tumour-derived cells from the indicated genotypes (***p<0.001; ns, not significant; one-way analysis of variance (ANOVA) with Dunnett’s post-test). (D) Survival of KPC wild type (+/+), KPC; R26L2+/KI and KPC; R26L2KI/KI mice. All mice died of PDAC associated disease at the indicated times (p value is shown; ns, not significant; log-rank (Mantel-Cox) test). Calculated median survivals are: wild type (+/+): 20 weeks; KPC; R26L2+/KI: 18 weeks; and KPC; R26L2KI/KI: 17 weeks. (E) Percent tumour incidence in KPC wild type (+/+), KPC; R26L2+/KI and KPC; R26L2KI/KI mice at 17–18 weeks post birth. (****P<0.0001; ns, not significant; contingency analysis; two-sided Fisher’s exact test). Tumour incidence was determined as positive if a macroscopic tumour was visible on necropsy. (F) Mean pancreas weight ±SEM in KPC wild type (+/+), KPC; R26L2+/KI and KPC; R26L2KI/KI mice at 17–18 weeks post birth. (*P<0.05, **p<0.01; ns, not significant; one-way ANOVA with Tukey post-test). (G) Representative images of PDAC tumours/genotype at 17–18 weeks post birth. (H) Quantification of tissue area in mouse pancreata from wild type (+/+) KPC mice (blue, n=7) and KPCL2KI (KPC; R26L2+/KI and KPC; R26L2KI/KI) mice (green, n=12) determined at 17–18 weeks post birth, categorised as severely altered tissue, PanINs I–III, PDAC or normal acinar tissue (*p<0.05, **p<0.01, contingency analysis, two-sided Fisher’s exact test). (I) Representative H&E-stained sections for the grading of the respective tumours: wild type (+/+) KPC (blue, n=6), KPC; R26L2+/KI (dark green, n=6) and KPC; R26L2KI/KI mice (light green, n=6). Pie chart insets=percent of differentiated (blue) vs poorly differentiated (yellow) tumours the indicated genotypes. Scale bar=250 µm. ADM, acinar-to-ductal metaplasia; KI, knock-in; Loxl2, lysyl oxidase-like protein 2; PanINS, pancreatic intraepithelial neoplasias; PDAC, pancreatic ductal adenocarcinoma; wt, wild type.

