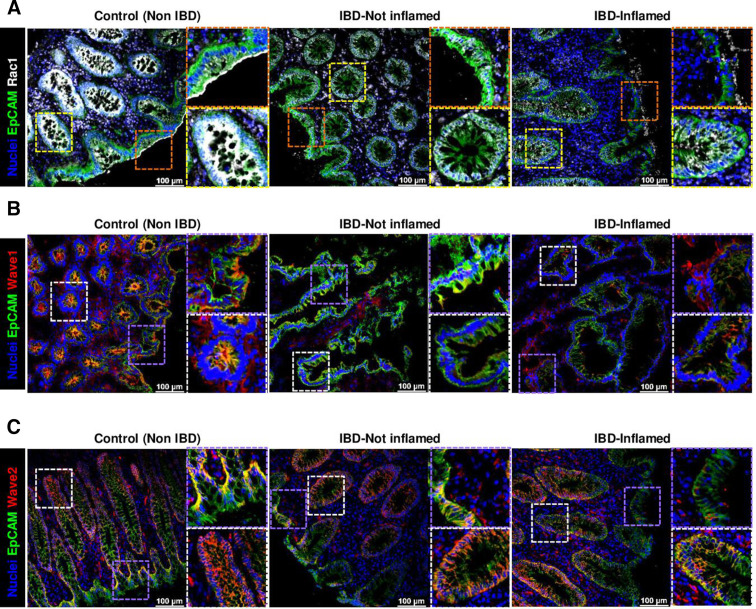
Figure 11.
Analysis of RAC1 pathway in human IBD. (A) RAC1 immunostaining (white), counterstained with EpCAM (green) and Hoechst (blue). Representative pictures, showing expression and subcellular localisation at the epithelial surface (top) and crypts (bottom) (n=20, total; n=9, Control; n=11, IBD). Wave1 (B) and Wave2 (C) immunostaining (red) (Wave1, n=13, total; n=5, Control; n=8, IBD); (Wave2, n=17, total; n=6, Control; n=11, IBD).

