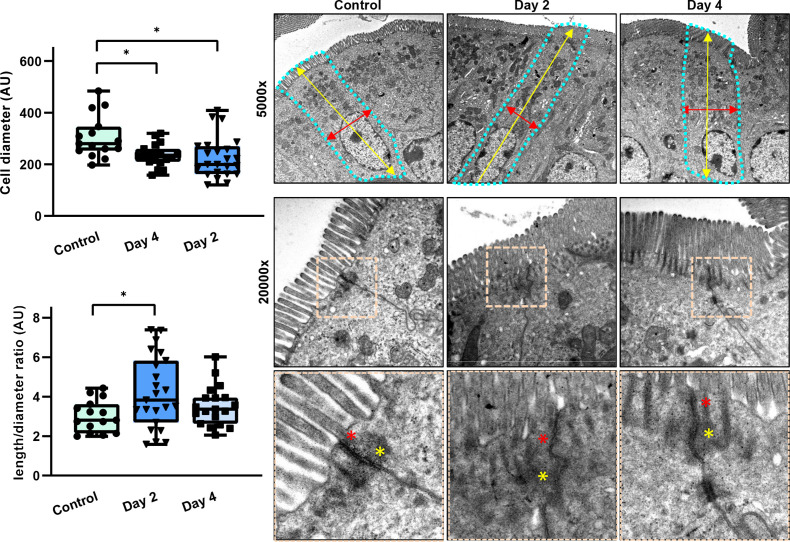
Figure 3.
TEM analysis of ileum tissue from control and Pggt1b iΔIEC mice (days 2 and 4). Quantification of cell diameter and cell length/diameter ratio (left); representative pictures (right). Cell shape is indicated by dotted turquoise lines; red arrows indicate cell diameter (between two lateral membranes) and yellow arrows indicate cell length (between basal and apical membrane). Within the AJC, tight junction zone is indicated by red asterisks, while yellow asterisks indicate Adherens junction zone. One sample/group. Data are expressed as box-plots (Min to Max). *P≤0.050. AJC, apical junction complex; TEM, transmission electron microscopy.

