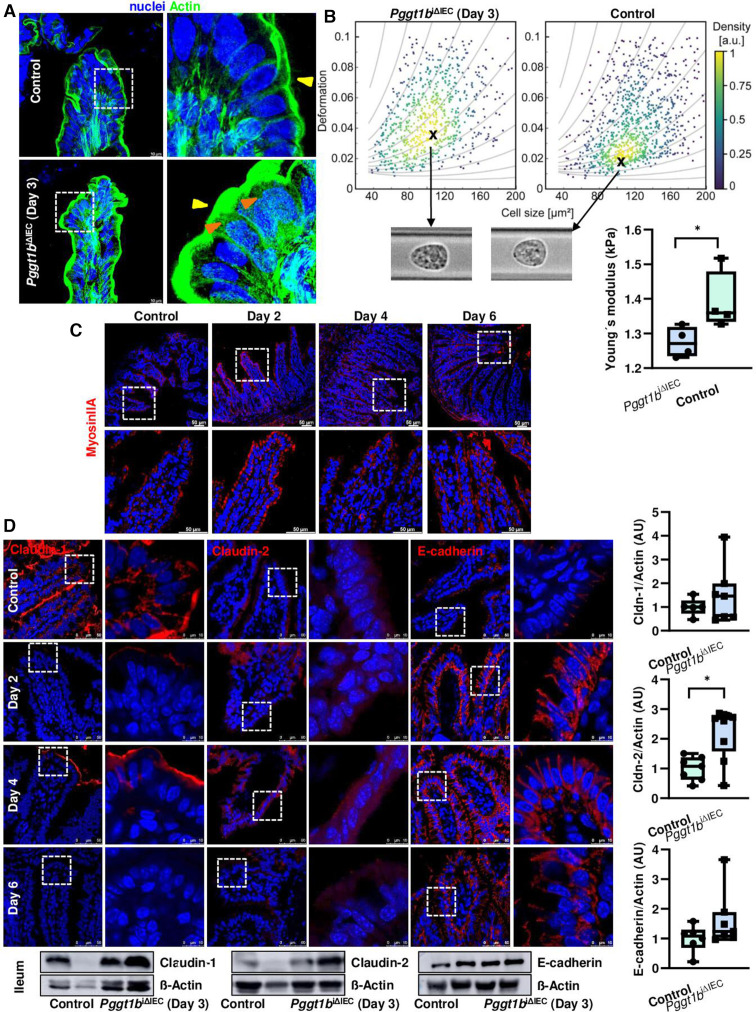
Figure 4.
Cytoskeleton rearrangement and altered cell mechanics in small intestine on deletion of Pggt1b. (A) F-actin fibre staining using AlexaFluor488-phalloidin in ileum tissue (green). High resolution confocal microscopy (Leica Stellaris). Representative pictures of a maximum projection (system optimised z-stack). Yellow arrows indicate apical actin network; orange arrows indicate redistribution of actin fibres. Three independent experiments. (B) Representative pictures of Myosin IIA staining (red) in ileum tissue (five independent experiments). Confocal microscopy (Leica SP8). (C) RT-FDC analysis from small intestine IECs (n=4/group). (D) Expression and redistribution of selected candidate AJC proteins in ileum tissue (claudin-1, claudin-2 and E-cadherin). Immunostaining (top, red signal) and western blot (bottom). Band densitometry quantification (right). Minimum five independent experiments. Data are expressed as box-plots (Min to Max). One-way ANOVA, Dunnett’s multiple comparisons test. *P≤0.050. AJC, apical junction complex; ANOVA, analysis of variance; RT-FDC, real time fluorescence deformability cytometry.

