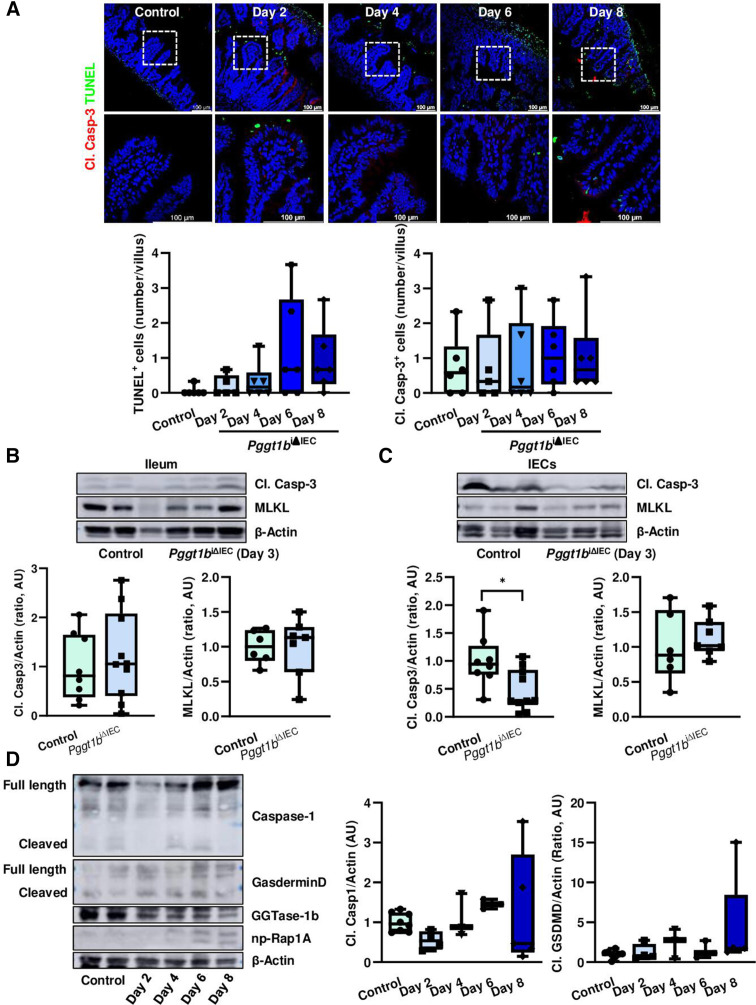
Figure 5.
Cell death activation on inhibition of prenylation within small intestinal epithelium. (A) TUNEL (green) and cleaved caspase-3 (red) staining in ileum cross-sections from control and Pggt1b iΔIEC mice at different time points. Representative pictures (top) and quantification (bottom) of TUNEL+ (left) and Cl. Casp-3+/villus (right). Six independent experiments. (B, C) Western blot analysis of cleaved caspase-3 and MLKL. Representative blots (top) and band densitometry quantification (bottom). (B) Ileum tissue (Cl. Casp-3; n=8, control; n=10, Pggt1b iΔIEC) (MLKL; n=6, control; n=7, Pggt1b iΔIEC). (C) Small intestine isolated IECs (Cl. Casp-3; n=8, control; n=10, Pggt1b iΔIEC) (MLKL; n=6, control; n=7, Pggt1b iΔIEC). (D) Detection of Caspase-1 and Gasdermin-D cleavage in small intestine IECs (western blot analysis). Representative blots (left) and band densitometry quantification (right). Four independent experiments. Data are expressed as box-plots (Min to Max). One-way ANOVA, Dunnett’s multiple comparisons test (A, D). Unpaired t test (B, C). *P≤0.050.

