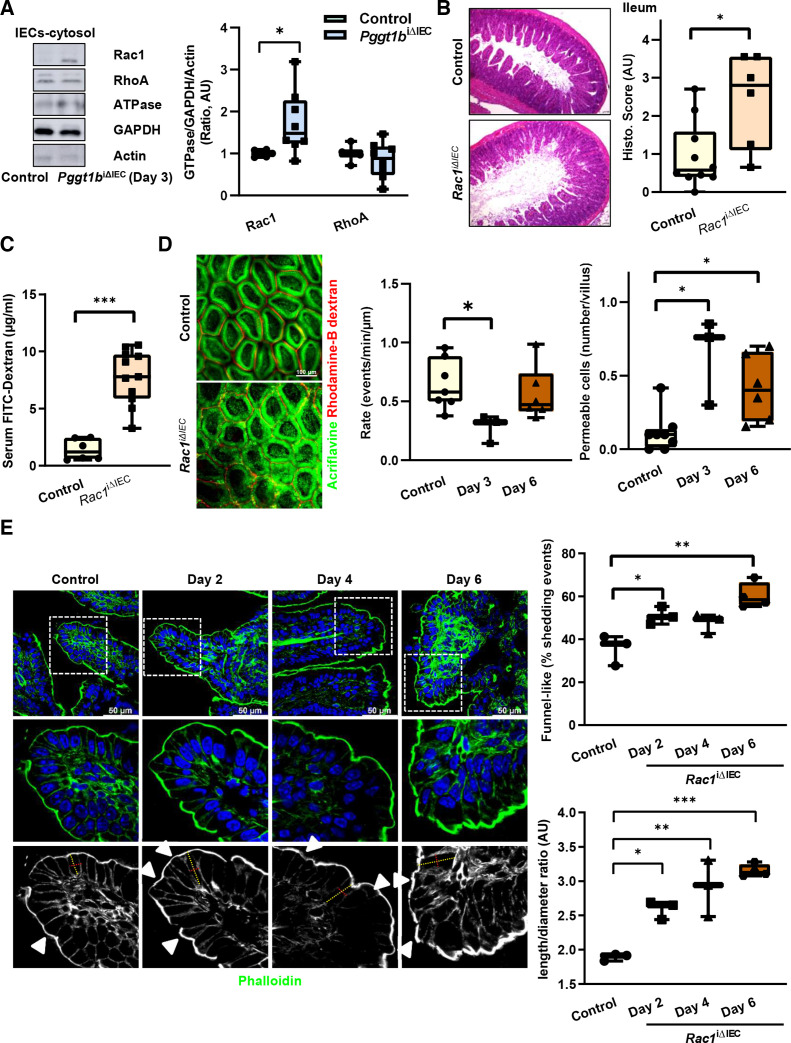
Figure 6.
RAC1 function within small intestine IECs is crucial for the maintenance of intestinal homeostasis. (A) Subcellular localisation of RAC1 and RHOA within small intestine IECs from control and Pggt1b iΔIEC mice at day 3 on tamoxifen treatment. Cytosolic proteins are separated via centrifugation gradient and small GTPases are detected via western blotting. Representative blots (left) and band densitometry quantification (right). Three experiments (n=6, control; n=8, Pggt1b iΔIEC). (B–E). Phenotype of Rac1 iΔIEC mice. (B–D) Intestinal pathology and cell shedding alterations in Rac1 iΔIEC mice. (B) Histology analysis of ileum tissue using H&E staining (day 7). Representative pictures (left) and histology score (right) (n=10, control; n=6, Rac1 iΔIEC). (C) Assessment of intestinal permeability in vivo. Transmucosal passage of orally administered FITC-Dextran; serum concentration (µg/mL) (n=6, Control; n=11, Rac1 iΔIEC). (D) Intravital microscopy analysis of cell shedding using luminal acriflavine (green) and rhodamineB-dextran (red) in small intestine. Representative pictures (left); and quantification of cell shedding rate (number of cell shedding events occurring over time in a single villus at a determined focus plane (events/minute/µm), and permeable cells (dextran is detected inside the cell) (events/villus). (n=8, Control; n=3, day 3; n=6, day 6). (E) Time course study. Three independent experiments. F-actin fibre staining using AlexaFluor488-phalloidin (green) in ileum tissue. Representative pictures (left); and quantification of funnel-like structures, indicated by white arrows (% of total cell shedding events) (top right); quantification of cell length/diameter ratio (bottom right). One-way ANOVA, Dunnett’s multiple comparisons test or unpaired t test. *P≤0.050; **P≤0.001; ***P≤0.0001. ANOVA, analysis of variance.

