Figure 7.
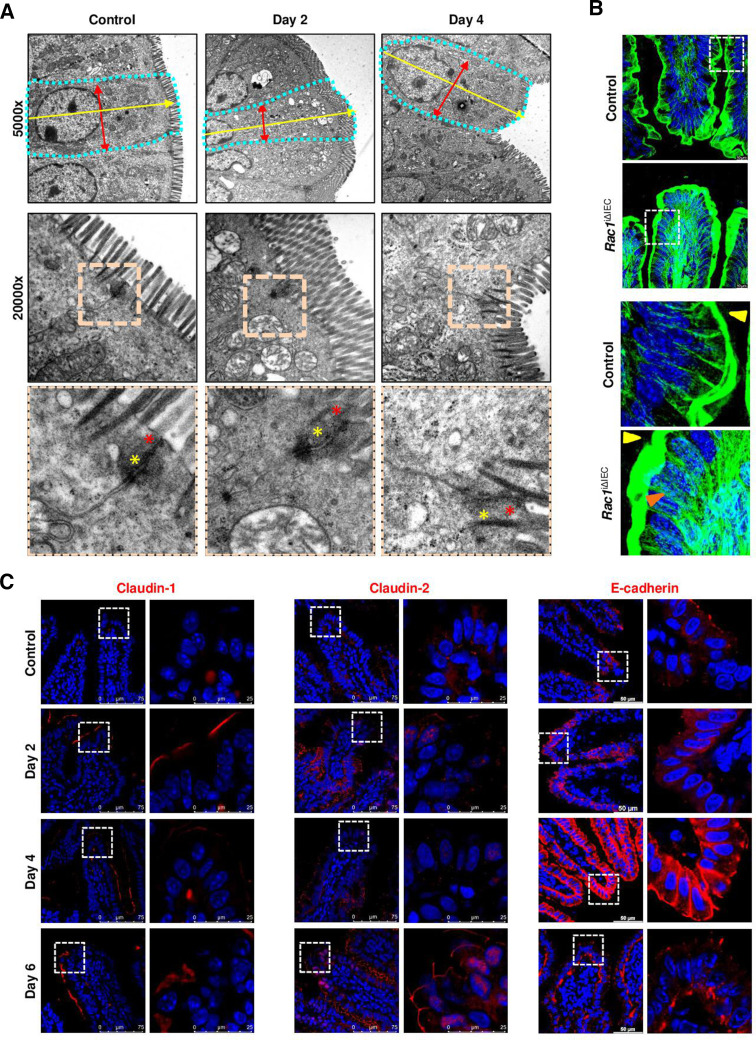
Cytoskeleton rearrangement in RAC1-deficient intestinal epithelium. (A) Electron microscopy analysis of ileum tissue. Representative pictures. Cell shape is indicated by dotted turquoise lines; red arrows indicate cell diameter (between two lateral membranes) and yellow arrows indicate cell length (between basal and apical membrane). Within the AJC, tight junction zone is indicated by red asterisks; while yellow asterisks indicate Adherens junction zone. One sample/group. (B) F-actin fibre staining using AlexaFluor488-phalloidin (green). High resolution confocal microscopy (Leica Stellaris). Maximum projection (system optimised z-stack). Yellow arrows indicate apical actin network; orange arrows indicate actin fibres. (C) Detection of selected candidate AJC proteins in ileum tissue (claudin-1, claudin-2, E-cadherin). Immunostaining (red signal). Three independent experiments. AJC, apical junction complex.

