Figure 9.
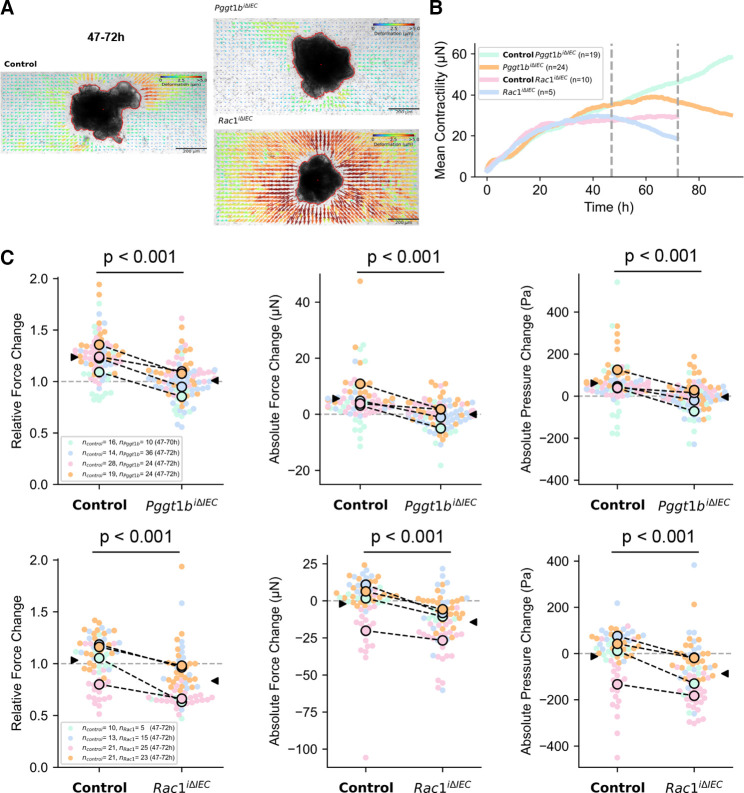
3D traction-force microscopy in control, GGTase and RAC1-deficient small intestine organoids. (A) Organoid-generated matrix deformations between 47 hours and 72 hours of time-lapse imaging (48–73 hours after completion of collagen polymerisation). Representative control organoid shows inward-directed matrix deformation, indicative of force increase, whereas representative Pggt1b iΔIEC and Rac1 iΔIEC organoids show outward-directed deformations, indicative of force relaxation. (B) Mean contractility over time for control, Pggt1b iΔIEC and Rac1 iΔIEC organoids, each pair from the same replicate experiment. Grey lines indicate the 47 hours and 72 hours time point for which force development is reported in the figures below. The measurement of the Pggt1b iΔIEC and corresponding control organoids was carried out over 90 hours to demonstrate that the force trends continue. (C) Relative and absolute changes in contractile force and absolute changes in contractile pressure between 47 hours and 72 hours. Each point represents the data from an individual organoid, colours represent four biological replicates. Black circles represent the mean value for each biological replicate, and black arrows represent the mean value of all organoids. P values are calculated from a two-sided Student’s t-test assuming unequal variances. Paired t-test. *P≤0.050.

