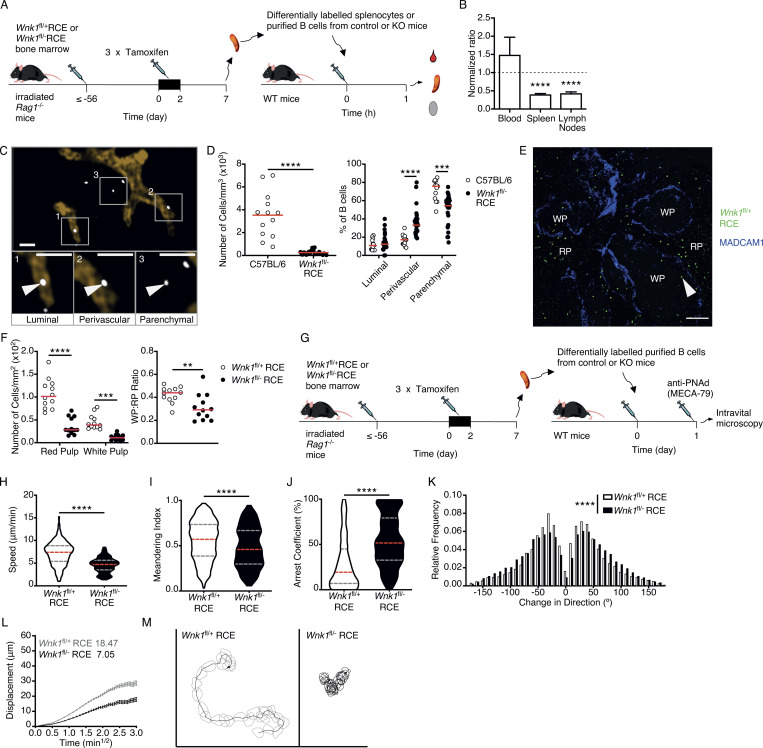
Figure 3.
WNK1 is required for efficient homing of B cells to lymphoid tissues, and migration within them. (A) Irradiated RAG1-deficient mice were reconstituted with Wnk1fl/+RCE or Wnk1fl/flRCE bone marrow. At least 56 d later, the mice were treated with tamoxifen on 3 consecutive days, splenocytes or splenic B cells were harvested 7 d after start of tamoxifen treatment, control and mutant cells were labeled with two different dyes, mixed at a 1:1 ratio, and transferred into WT mice, and 1 h after transfer, blood, spleen, and LNs were analyzed. (B) Mean ± SEM ratio of WNK1-deficient mouse B cells to control B cells in blood, spleen, and LNs of mice treated as described in A. (C) Example image from analysis of three-dimensional histology of LNs 40 min after transfer of either WT or WNK1-deficient dye-labeled B cells into C57BL6/J mice, showing how the localization of transferred B cells was categorized as luminal, perivascular, or parenchymal. White boxes (1–3) indicate areas that are enlarged below, and white arrowheads indicate cells that fall into the indicated category. Scale bar, 30 μm. (D) Analysis of three-dimensional histology of LNs showing number of cells per mm3 (left), and relative frequency of B cells in the luminal, perivascular, and parenchymal regions (right), 40 min after transfer of either WT or WNK1-deficient B cells into WT mice. Each dot is data from one mouse; red line indicates mean. (E) Example image from analysis of histology of spleen 1 h after transfer of either control of WNK1-deficient B cells into C57BL/6J mice, showing transferred cells (green, indicated with white arrowhead) and MADCAM1 staining (blue). Cells in the white pulp (WP) were defined as cells within MADCAM1 staining, and cells in red pulp (RP) were defined as outside the MADCAM1 staining. Scale bar, 100 μm. (F) Number of B cells/mm2 in the red and white pulp of the spleen (left), and ratio of cells in the white pulp vs. red pulp (right), of mice treated as described in A and analyzed as in E. (G) Irradiated RAG1-deficient mice were reconstituted with Wnk1fl/+RCE or Wnk1fl/flRCE bone marrow. At least 56 d later, the mice were treated with tamoxifen on 3 consecutive days, and splenic B cells were harvested 7 d after the start of tamoxifen treatment and labeled with two different dyes. (H–M) Control and WNK1-deficient B cells were transferred into WT mice, and 24 h later, anti-PNAd (MECA-79) was injected and B cell migration in LN follicles was analyzed by intravital microscopy, with results shown in H–M. (H–J) Violin plots of migration speed (H), meandering index (I), and arrest coefficient (J); dashed lines indicate median (red) and 25th and 75th percentiles (gray). (K) Relative frequency of change of angle in migration path. (L) Mean ± SEM displacement of B cells as a function of the square root of time (time1/2); motility coefficients calculated from the slope of the graph are indicated. (M) Typical tracks of a control B cell and a WNK1-deficient B cell, showing cell shapes over 15 min. One-sample t test (B), Mann–Whitney test (D [left], F [right], H–K), two-way ANOVA (D [right], F [left]); **, 0.001 < P < 0.01, ***, 0.0001 < P < 0.001, ****, P < 0.0001. Sample sizes: 8 (B); 13 WT, 26 mutant (D); 12 sections from three mice per genotype (F); and 5,441 WNK1-deficient tracks, 16,196 control tracks (H–L). Data are pooled from two independent experiments.

