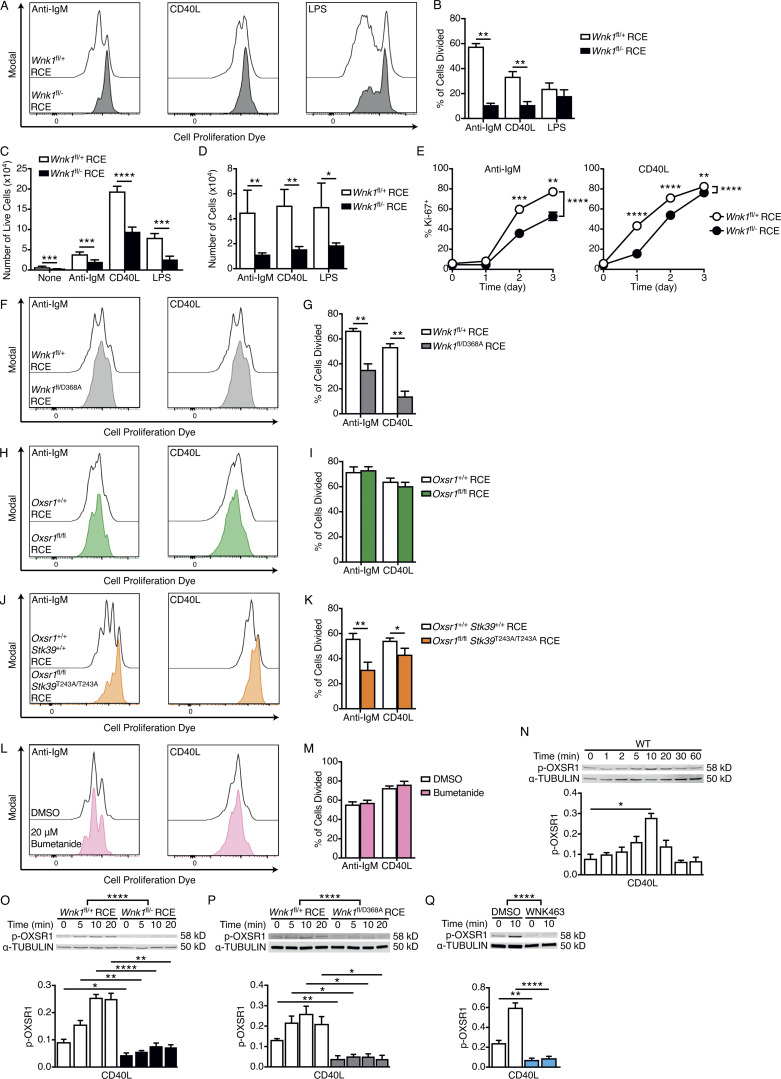
Figure 4.
WNK1 is required for BCR- and CD40-induced B cell proliferation in vitro. (A and B) B cells of the indicated genotypes labeled with CPD were cultured for 72 h in the presence of anti-IgM, CD40L, or LPS. (A) Representative histograms of CPD fluorescence measured by flow cytometry; cell division results in dye dilution. (B) Mean ± SEM percentage of B cells that have divided at least once after 72 h stimulation with either anti-IgM, CD40L, or LPS. (C) Mean ± SEM number of live control or WNK1-deficient B cells after 72 h culture with the indicated stimuli. (D) Mean ± SEM number of cells after 72 h culture if there had been no division. (E) Mean ± SEM percentage of Ki-67+ B cells after stimulation with anti-IgM or CD40L for the indicated times. (F–M) CPD-labeled B cells of the indicated genotypes (F–K), or WT B cells treated with bumetanide or vehicle control (L and M), were labeled with CPD and cultured for 72 h in the presence of anti-IgM or CD40L. (F, H, J, and L) Histograms of CPD fluorescence. (G, I, K, and M) Mean ± SEM percentage of B cells that have divided at least once after 72 h in response to the indicated stimuli. (N–Q) Top: Immunoblots of total cell lysates from mouse B cells stimulated for the indicated times with CD40L using WT B cells (N), WNK1-deficient or control B cells (O), B cells expressing kinase-inactive WNK1-D368A or control B cells (P), or WT B cells treated with vehicle (DMSO), or an inhibitor of WNK family kinases (WNK463; Q), probed with antibodies to p-OXSR1 or α-TUBULIN. Bottom: Graphs of mean ± SEM abundance of p-OXSR1 in the lanes above, normalized to α-TUBULIN. Mann–Whitney test (B–D, G, I, K, and N), two-way ANOVA (E and O–Q); *, 0.01 < P < 0.05; **, 0.001 < P < 0.01; ***, 0.0001 < P < 0.001; ****, P < 0.0001. Sample sizes: 5 WNK1-deficient, 6 control (B and D); 9 WNK1-deficient, 15 control (C); 7 WNK1-deficient, 6 control (E); 4 WNK1-D368A, 6 control (G); 6 (I and M); 7 (K); 4 (N); and 5 (O–Q). Data are pooled from two (B, D, E, G, I, and K–Q) or three (C) independent experiments. Source data are available for this figure: SourceData F4.

