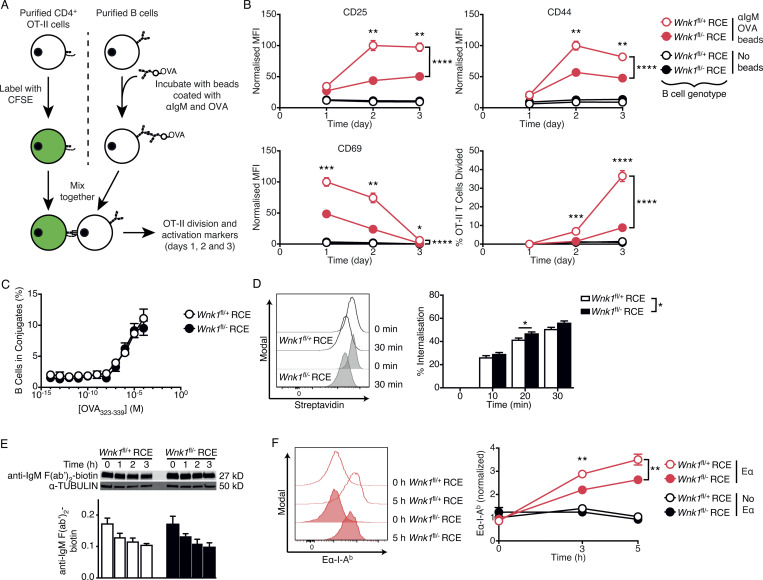
Figure 5.
B cells require WNK1 to collaborate efficiently with T cells in vitro. (A) Purified CD4+ from OT-II mice were labeled with CFSE and cultured with control or WNK1-deficient B cells that have or have not been incubated with beads coated in anti-IgM and OVA for 24, 48, and 72 h, and activation marker upregulation and cell division was measured using flow cytometry. (B) Mean ± SEM normalized median fluorescence intensity (MFI) of CD25, CD44, and CD69, and percentage of cells that have divided at least once (bottom right), of OT-II CD4+ T cells cultured for the indicated times with control (open circles) or WNK1-deficient (filled circles) B cells that have been previously incubated with beads coated in anti-IgM and OVA (red) or not incubated with beads (black). MFI was normalized to the maximal response of each individual activation marker (set to 100). (C) Mean ± SEM percentage of control or WNK1-deficient B cells that formed conjugates with OT-II T cells as a function of concentration of OVA323-339 peptide. (D) B cells of the indicated genotypes were incubated with biotinylated anti-kappa F(ab′)2 for the indicated times and residual biotin on the surface revealed with streptavidin as a measure of internalization. Histograms (left) show streptavidin binding; graph (right) shows mean ± SEM percentage internalization of the antibody. (E) Immunoblot analysis (top) of total cell lysates from control or WNK1-deficient mouse B cells incubated with biotinylated anti-IgM F(ab′)2 for the indicated times, probed with streptavidin to detect biotin, or with an antibody to α-TUBULIN. Graph (bottom) shows mean ± SEM abundance of biotinylated anti-IgM F(ab′)2 in the lanes above, normalized to α-TUBULIN; no significant difference was seen between genotypes (two-way ANOVA). (F) Histograms (left) of levels of Eα peptide on I-Ab MHC class II on surface of control or WNK1-deficient B cells incubated with Eα peptide–anti-IgM conjugates for the indicated times. Graph (right) shows mean ± SEM normalized MFI of Eα-I-Ab complex normalized to levels of I-Ab MHC class II and to control Eα sample at 0 h (set to 1) as a measure of antigen presentation of control (open circles) or WNK1-deficient (filled circles) B cells incubated with beads coated with anti-IgM and Eα (Eα, red) or just anti-IgM (no Eα, black). Two-way ANOVA (C–E), three-way ANOVA (B and F); *, 0.01 < P < 0.05; **, 0.001 < P < 0.01; ***, 0.0001 < P < 0.001; ****, P < 0.0001. Sample sizes: 7 WNK1-deficient, 10 control (B); 6 (C and E), 8 (D); and 7 (F). Data are pooled from two independent experiments. Source data are available for this figure: SourceData F5.

