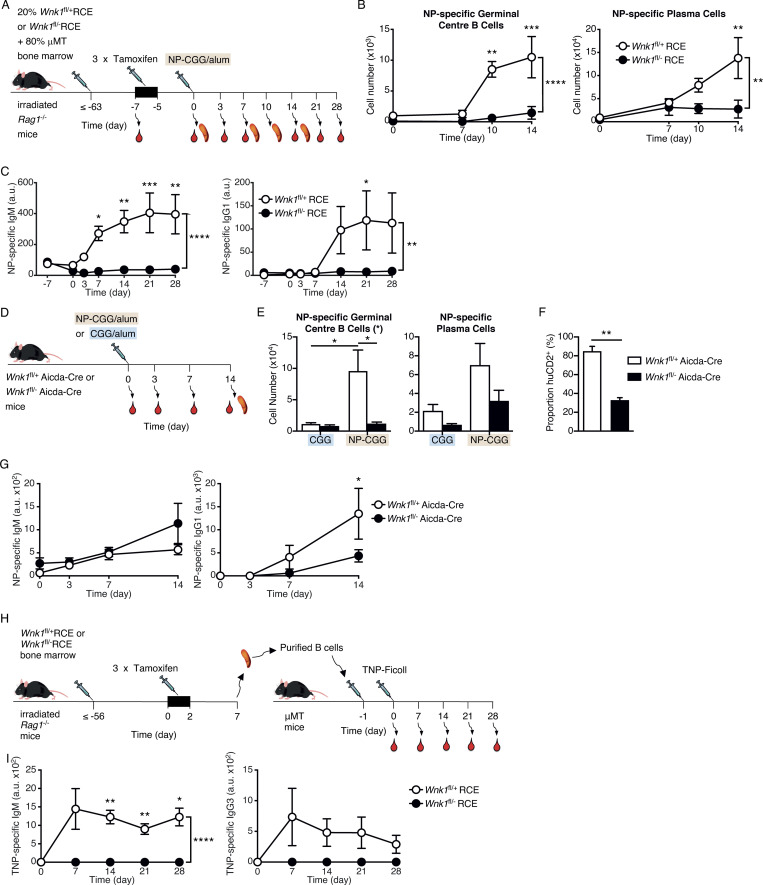
Figure 6.
WNK1-deficient B cells fail to mount T-dependent and independent antibody responses. (A) Irradiated RAG1-deficient mice were reconstituted with a mixture of Wnk1fl/+RCE or Wnk1fl/flRCE bone marrow (20%) and μMT marrow (80%). At least 56 d later, blood was taken from the mice and they were treated with tamoxifen on 3 consecutive days, immunized with NP-CGG in alum 7 d after start of tamoxifen treatment, and blood and/or spleen were analyzed 0, 3, 7, 10, 14, 21 and 28 d later. (B and C) Graphs of mean ± SEM numbers of splenic NP-specific GCB cells and plasma cells (B) and mean ± SEM serum levels of NP-specific IgM and IgG1 (C) in mice treated as described in A. (D) Wnk1fl/+Aicda-Cre or Wnk1fl/−Aicda-Cre mice were immunized with NP-CGG or CGG in alum and analyzed 0, 3, 7, and 14 d later. (E–G) Mean ± SEM numbers of splenic NP-specific GCB cells and plasma cells (E), mean ± SEM proportion of GCB cells that were hCD2+, a marker of Cre expression (F), and mean ± SEM serum levels of NP-specific IgM and IgG1 (G) in mice treated as in D. (H) Irradiated RAG1-deficient mice were reconstituted with Wnk1fl/+RCE or Wnk1fl/flRCE bone marrow. At least 56 d later, the mice were treated with tamoxifen on 3 consecutive days, and splenic B cells were harvested 7 d after start of tamoxifen treatment and transferred into μMT mice. 1 d later, the mice were immunized with TNP-Ficoll, and blood was analyzed 0–28 d later. (I) Mean ± SEM serum levels of TNP-specific IgM and IgG3 in mice treated as in H. Two-way ANOVA (B, C, E, G, and I), Mann–Whitney test (F); *, 0.01 < P < 0.05; **, 0.001 < P < 0.01; ***, 0.0001 < P < 0.001; ****, P < 0.0001. Sample sizes: three to four (B); four to six (C); four to five (E and F); five (G); and seven control and six mutant (I). Data are from two (B, C, and E–G) or three (I) independent experiments.

