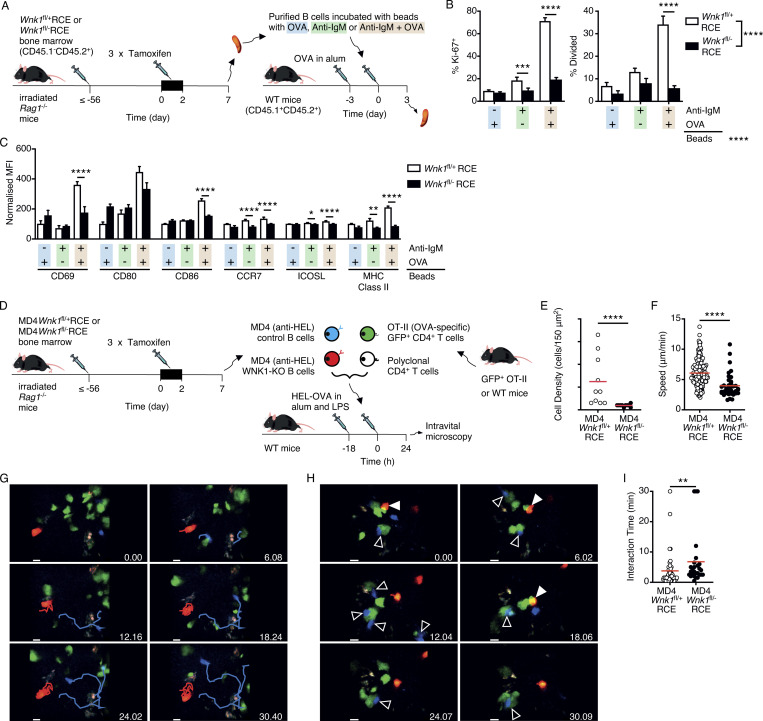
Figure 7.
Defective activation of WNK1-deficient B cells by cognate T cells in vivo. (A) Irradiated RAG1-deficient mice were reconstituted with Wnk1fl/+RCE or Wnk1fl/flRCE bone marrow (CD45.1−CD45.2+). At least 56 d later, the mice were treated with tamoxifen on 3 consecutive days, and splenic B cells were harvested 7 d after start of tamoxifen treatment, labeled with CMFDA, and incubated with beads coated in anti-IgM and OVA, just anti-IgM, or just OVA. The labeled B cells were transferred into WT mice (CD45.1+CD45.2+) that had been immunized with OVA in alum 3 d earlier. 3 d after transfer, spleens were harvested and analyzed for activation markers and division by flow cytometry. (B) Mean ± SEM percentage of transferred control or WNK1-deficient B cells from mice treated as described in A that express Ki-67 (left) or have divided at least once (right). (C) Mean ± SEM MFI of the indicated cell surface proteins on transferred control or WNK1-deficient B cells from mice treated as described in A, normalized to the levels on control B cells incubated with beads coated in just OVA (set to 100). (D) Irradiated RAG1-deficient mice were reconstituted with MD4Wnk1fl/+RCE or MD4Wnk1fl/flRCE bone marrow. At least 56 d later, the mice were treated with tamoxifen on 3 consecutive days, and splenic B cells were harvested 7 d after the start of tamoxifen treatment, dye-labeled, and transferred into C57BL/6J mice that had been immunized in the hock with HEL-OVA in alum and LPS 18 h earlier, along with GFP+ OT-II CD4+ T cells and dye-labeled polyclonal CD4+ T cells. 1 d later, the labeled cells were imaged at the B-T border in the draining popliteal LNs by MP-IVM. Results are shown in E–I. (E) Density of B cells of the indicated genotype in a 150 μm2 field of view. (F) Migration speed; each point represents a single B cell. (G) Time-lapse images showing migration paths of WNK1-expressing (blue) and WNK1-deficient (red) MD4 B cells. Scale bar, 10 μm. (H) Time-lapse images showing interaction of WNK1-expressing (blue, open arrow) or WNK1-deficient (red, filled arrow) MD4 B cells with OT-II T cells (green); polyclonal T cells not shown. Scale bar, 10 μm. (I) Graph of interaction times of MD4 B cells with OT-II T cells. Red lines indicate mean. Two-way ANOVA (B and C), Mann–Whitney test (E, F, and I); *, 0.01 < P < 0.05; **, 0.001 < P < 0.01; ***, 0.0001 < P < 0.001; ****, P < 0.0001. Sample sizes: 7–8 (B and C); 10 fields of view (E); 235 control and 38 mutant cells (F); and 46 control and 27 mutant B cells (I). Data are pooled from two independent experiments.

