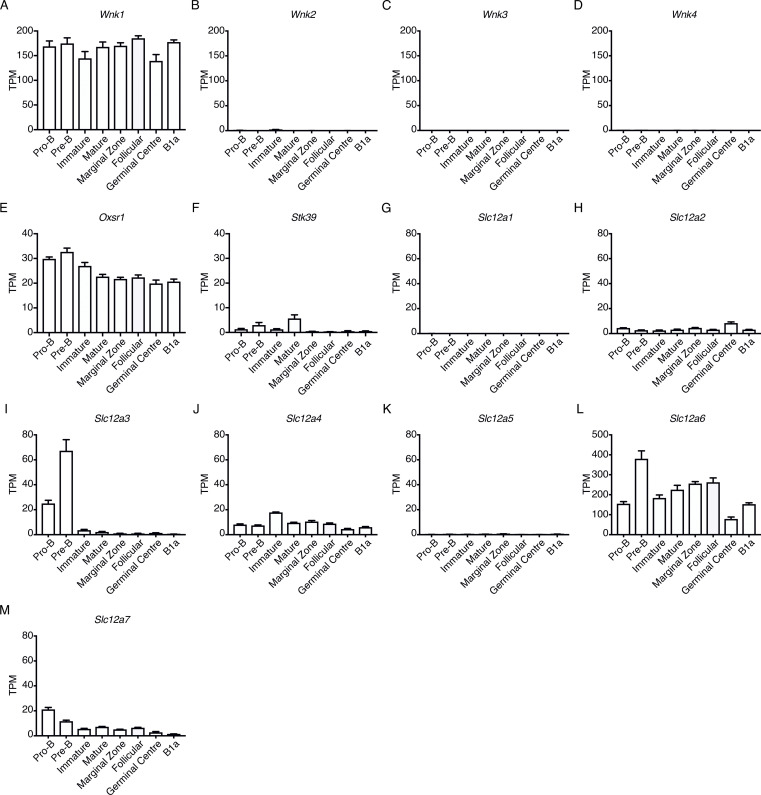
Figure S1.
Expression of WNK pathway genes in B cell subsets. (A–M) Mean ± SEM expression levels of the indicated genes in pro-B, pre-B, immature B and mature B cells in bone marrow, marginal zone, follicular, and GCB cells in spleen, and B1a cells from the peritoneal cavity as determined by RNAseq (Brazão et al., 2016). Expression is measured as transcripts per million (TPM). Sample size: five.

