Figure S2.
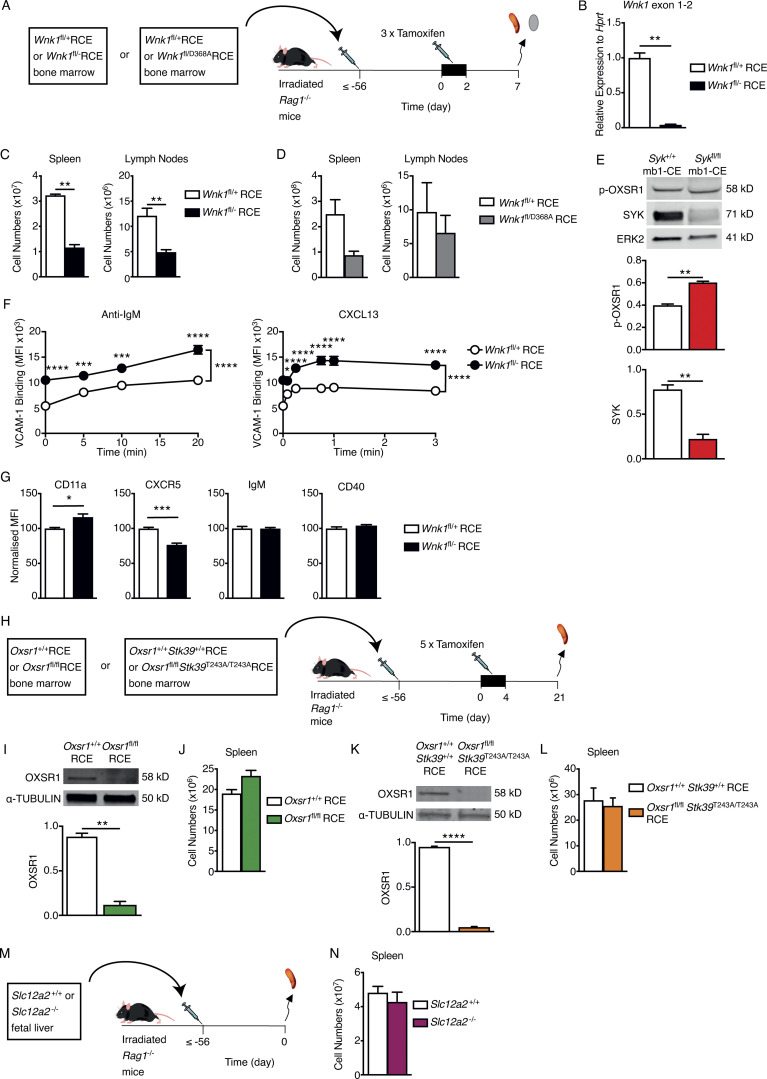
Characterization of mice with mutations in WNK1 pathway genes. (A) Irradiated RAG1-deficient mice were reconstituted with bone marrow from either Wnk1fl/+RCE or Wnk1fl/flRCE mice, or from Wnk1fl/+RCE or Wnk1fl/D368ARCE mice. At least 56 d later, mice were treated with tamoxifen on 3 consecutive days and analyzed 7 d after the start of tamoxifen treatment. (B) Mean ± SEM levels of Wnk1 mRNA measured across the junction of exons 1 and 2 in control or WNK1-deficient splenic mature B cells, normalized to Hprt expression and to Wnk1 mRNA levels in control B cells (set to 1). (C and D) Mean ± SEM numbers of mature B cells in the spleen (B220+CD19+CD93−) and LNs (TCRβ−B220+IgM+IgD+) of RAG1-deficient mice reconstituted with Wnk1fl/+RCE or Wnk1fl/flRCE marrow (C) or with Wnk1fl/+RCE or Wnk1fl/D368ARCE marrow (D), as described in A. (E) Top: Immunoblots of total cell lysates from splenic B cells from either Syk+/+ mb1-creERT2 (mb1-CE) or Sykfl/fl mb1-CE mice that had been treated with tamoxifen for 5 consecutive days 21 d prior, probed with antibodies to p-OXSR1, SYK, or ERK2. Bottom: Graphs of mean ± SEM abundance of p-OXSR1 and SYK in the lanes above, normalized to ERK2. (F) Mean ± SEM binding of soluble VCAM-1 complexes to control or WNK1-deficient B cells in response to treatment with anti-IgM or CXCL13 for the indicated times. (G) Mean ± SEM surface levels of CD11a, CXCR5, IgM, and CD40 on control or WNK1-deficient B cells normalized to expression on control B cells (set to 100). (H) Irradiated RAG1-deficient mice were reconstituted with bone marrow from either Oxsr1+/+RCE or Oxsr1fl/flRCE mice, or from Oxsr1+/+Stk39+/+RCE or Oxsr1fl/flStk39T243A/T243ARCE mice. At least 56 d later, mice were treated with tamoxifen on 5 consecutive days and analyzed 21 d after the start of tamoxifen. (I and K) Immunoblot analysis (top) of total cell lysates from splenic B cells from RAG1-deficient mice reconstituted with Oxsr1+/+RCE or Oxsr1fl/flRCE marrow (I) or with Oxsr1+/+Stk39+/+RCE or Oxsr1fl/flStk39T243A/T243ARCE marrow (K), probed with antibodies to OXSR1 and α-TUBULIN. Graph (bottom) shows mean ± SEM amount of OXSR1 in the lanes above, normalized to the abundance of α-TUBULIN in each lane. (J and L) Mean ± SEM numbers of mature B cells in the spleen (B220+CD19+CD93−) of RAG1-deficient mice reconstituted with Oxsr1+/+RCE or Oxsr1fl/flRCE marrow (J), or with Oxsr1+/+Stk39+/+RCE or Oxsr1fl/flStk39T243A/T243ARCE marrow (L), as described in H. (M) Irradiated RAG1-deficient mice were reconstituted with fetal liver from either Slc12a2+/+ or Slc12a2−/− fetuses. Mice were analyzed least 56 d later. (N) Mean ± SEM numbers of mature B cells in the spleen (B220+CD19+CD93−) of mice described in M. Mann–Whitney test (B–E, I–L, and N); two-way ANOVA (F); *, 0.01 < P < 0.05; **, 0.001 < P < 0.01; ***, 0.0001 < P < 0.001; ****, P < 0.0001. Sample sizes: 6 (B and D–F); 5 (C and I); 7 (G and L); 3–4 (J); 12 (K); and 5 control and 4 mutant mice (N). Data are pooled from two independent experiments. Source data are available for this figure: SourceData FS2.

