Fig. 3.
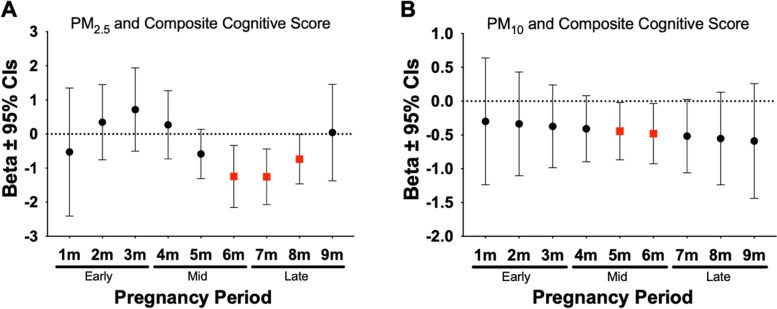
Associations Between PM10 and PM2.5 Exposure During Mid to Late Pregnancy and Composite Cognitive Scores at 2 Years. Figures show effect sizes and 95% confidence intervals (CI) at each monthly lag of exposure during the pregnancy period. Results were obtained from distributed lag models (DLMs) that adjusted for socioeconomic status (SES), breast feedings per day, gestational age, pre-pregnancy BMI, infant birthweight, and infant sex. Panels show associations between PM2.5 and composite cognitive score (A), PM10 and composite cognitive score (B). Effect sizes are scaled by the IQR of each respective pollutant (PM10 = 8 µg/m3, PM2.5 = 3 µg/m3). Statistically significant windows are denoted by red squares (p < 0.05)

