Fig. 1.
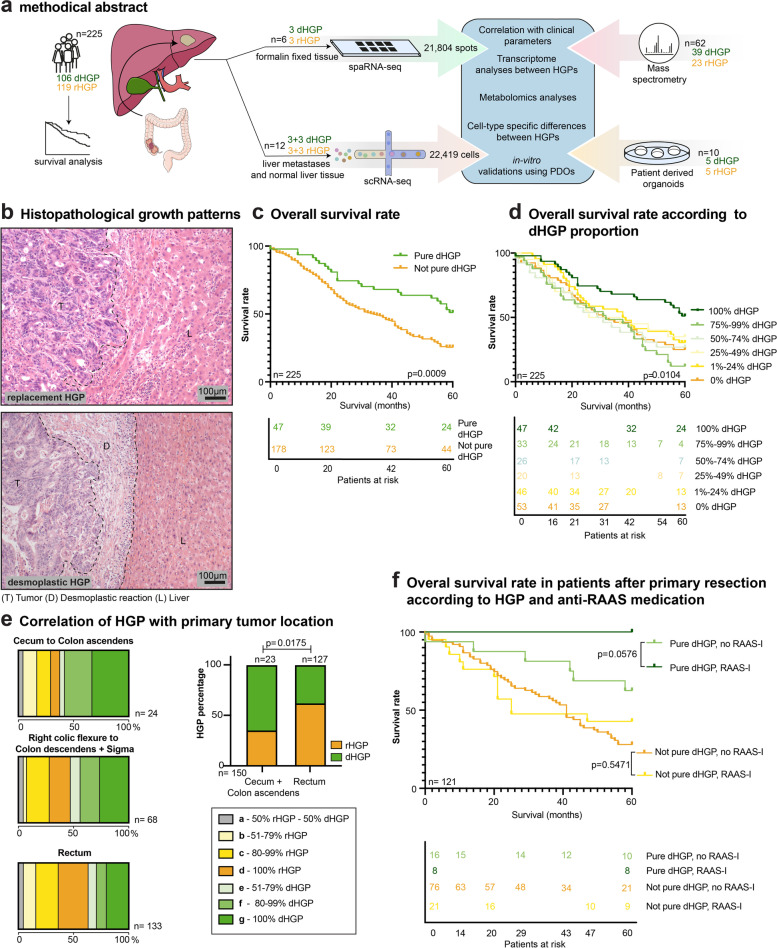
Primary tumors localized in the rectum are more likely to develop rHGP CRCLM. (a) Graphical abstract of the experimental workflow. (b) Representative H&E images of rHGP and dHGP. T: tumor; L: liver; D: desmoplastic rim. (c) Kaplan–Meier curves: OS after CRCLM resection depending on the HGP (n = 225). (d) Kaplan–Meier curves: sub-stratified OS after CRCLM resection depending on the percentage of dHGP (n = 225). (e) Left box charts: HGP distribution of CRCLM in the context of the localization of the primary tumor. Right bar plot: predominant HGP (after exclusion of CRCLM with 50% of each HGP), in the context of the localization of the primary tumor (p value by chi-square test). (f) Kaplan–Meier curves: OS after CRCLM resection depending on the HGP and the application of therapeutic RAAS inhibition (RAAS-I) in the pre-treatment-naive subgroup (n = 121). P values were calculated by two-sided log-rank test

