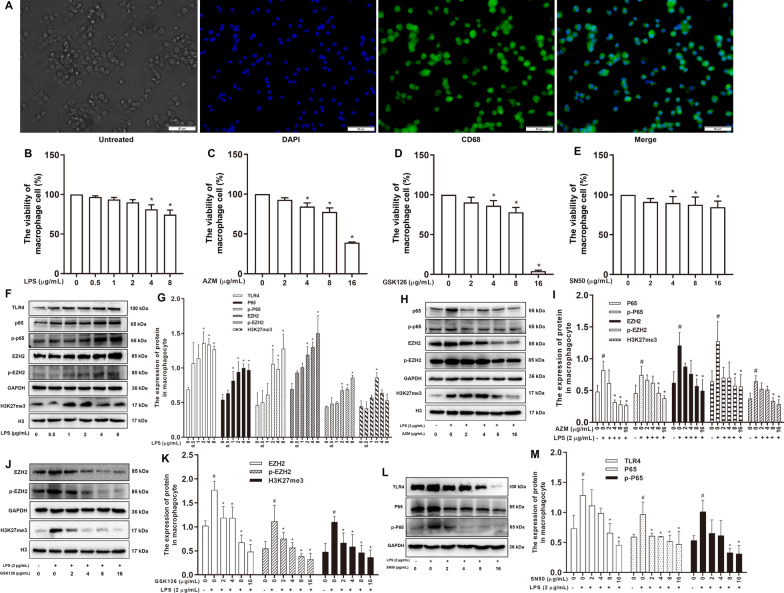
Fig. 4.
Selection of optimal concentrations of LPS, AZM, GSK126 and SN50 in rat alveolar macrophages. A Green (CD68), blue (DAPI). The scale bars represent 50 μm. B–E The cell viability of different concentrations of LPS, AZM, GSK126 and SN50. *P < 0.05 versus the 0 µg/mL group (n = 3). F Western blotting analysis of the expression levels of TLR4, NF-κB P65, NF-κB p-P65, EZH2, p-EZH2 and H3K27me3 in rat alveolar macrophages (NR8383) treated with different LPS concentrations and G quantification. #P < 0.05 versus the 0 µg/mL LPS group (n = 3). H Western blot analysis of the expression levels of NF-κB P65, NF-κB p-P65, EZH2, p-EZH2 and H3K27me3 in LPS-treated NR8383 cells at different AZM concentrations and I quantification. #P < 0.05 versus the 0 µg/mL LPS group, *P < 0.05 versus the 2 µg/mL LPS + 0 µg/mL AZM (n = 3). J Western blotting analysis of the expression levels of EZH2, p-EZH2 and H3K27me3 in LPS-treated NR8383 cells at different GSK126 concentrations and K quantification. #P < 0.05 versus the 0 µg/mL LPS group, *P < 0.05 versus the 2 µg/mL LPS + 0 µg/mL GSK126 (n = 3). L Western blotting analysis of the expression levels of TLR4, NF-κB P65 and NF-κB p-P65 in LPS-treated NR8383 cells at different SN50 concentrations and M quantification. #P < 0.05 versus the 0 µg/mL LPS group, *P < 0.05 versus the 2 µg/mL LPS + 0 µg/mL SN50 (n = 3)

