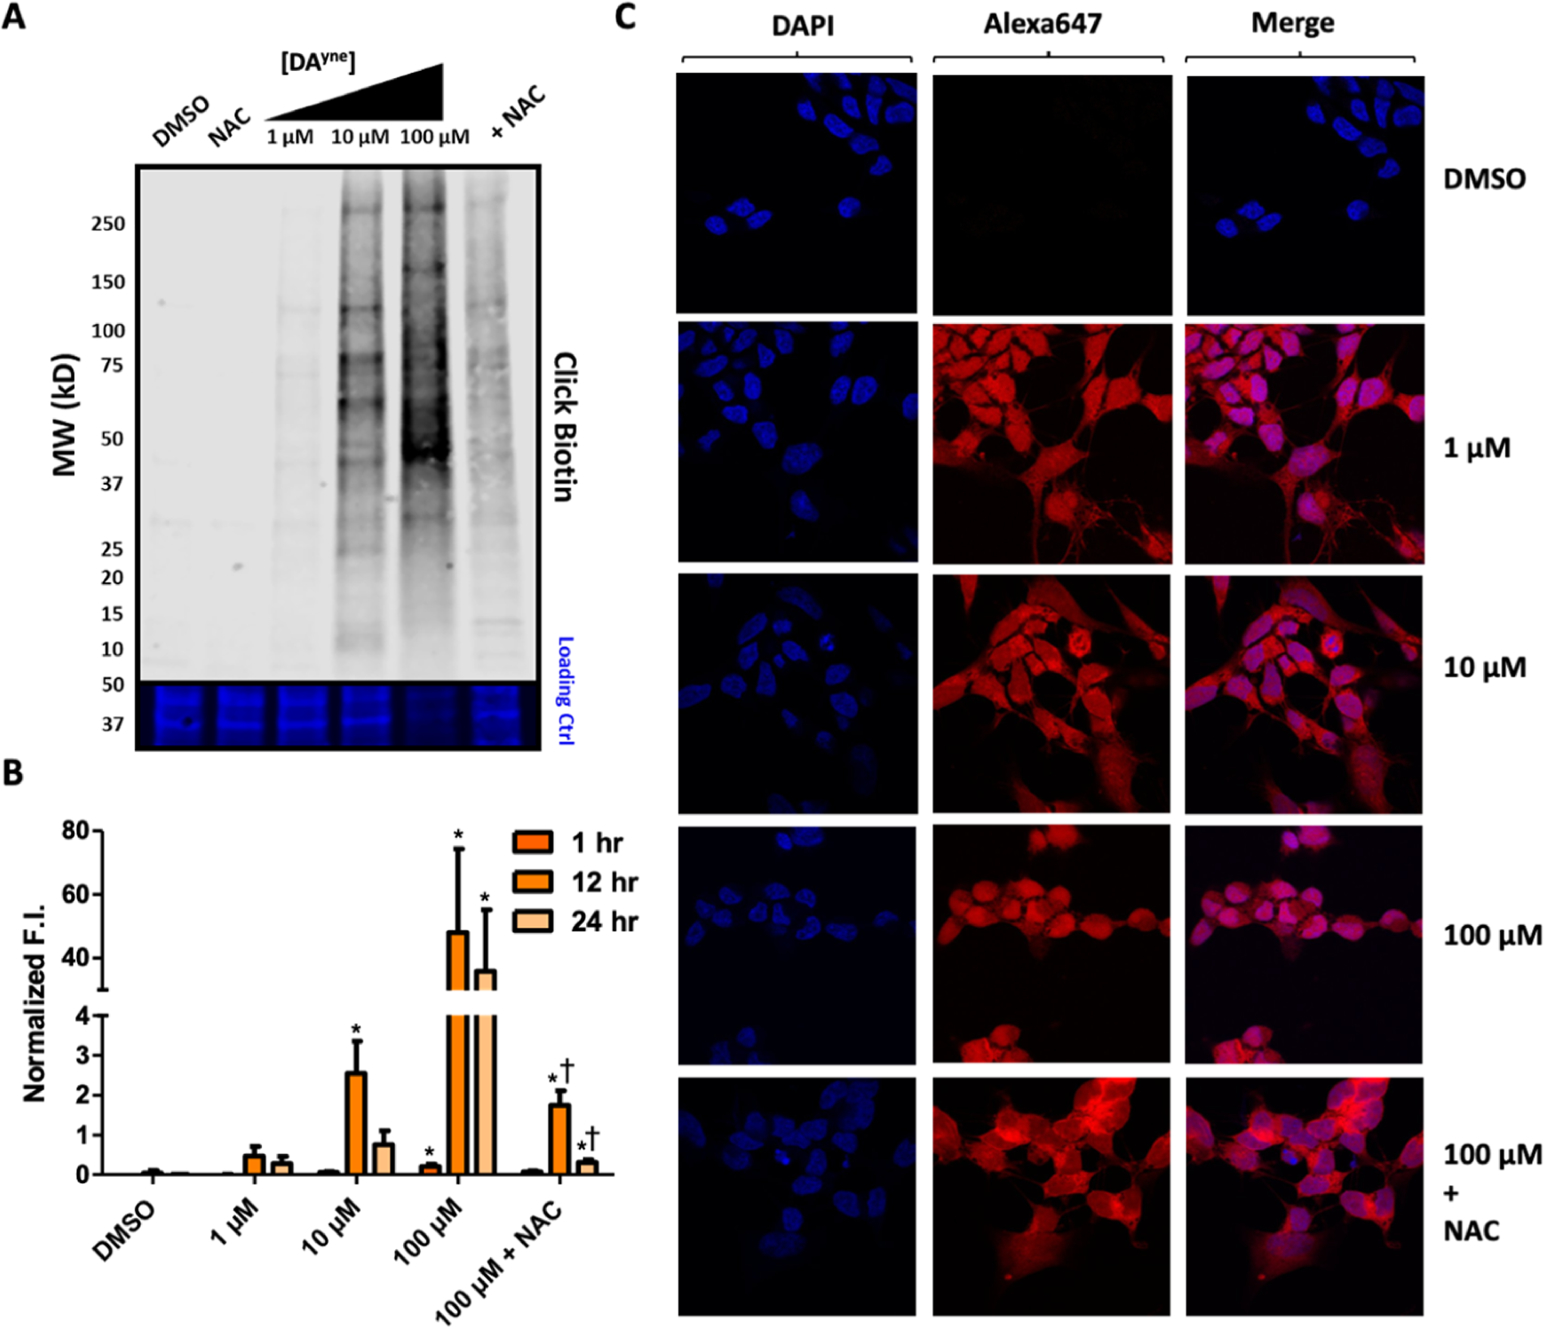
Figure 5.

Visualization of DPAs by DAyne. (A) Representative nitrocellulose blot following incubation of SH-SY5Y cells with DMSO, 2.5 mM NAC, 1 μM, 10 μM, 100 μM, or 100 μM DAyne and 2.5 mM NAC for 12 h, lysis and ensuing CuAAC click reaction with biotin azide. Top: 800 nm channel following incubation with SA800. Bottom: 700 nm channel following REVERT total protein stain. (B) Quantification of DPAs. Fluorescence intensity (F.I.) of SA800 for each treatment was normalized by total protein through the REVERT stain. Data are represented as mean ± SEM from three replicates. Data were analyzed via a two-way ANOVA and an unpaired t-test. (Comparisons between: DMSO *p < 0.05; 100 μM DAyne †p < 0.05 for given treatment duration). (C) Confocal imaging of SH-SY5Y cells following treatment with DMSO, 1 μM, 10 μM, 100 μM, or 100 μM DAyne and 2.5 mM NAC, respectively for 12 h, fixation with paraformaldehyde, ensuing CuAAC click reaction with Alexa Fluor 647 azide and staining with DAPI. Images were acquired at 60× magnification.
