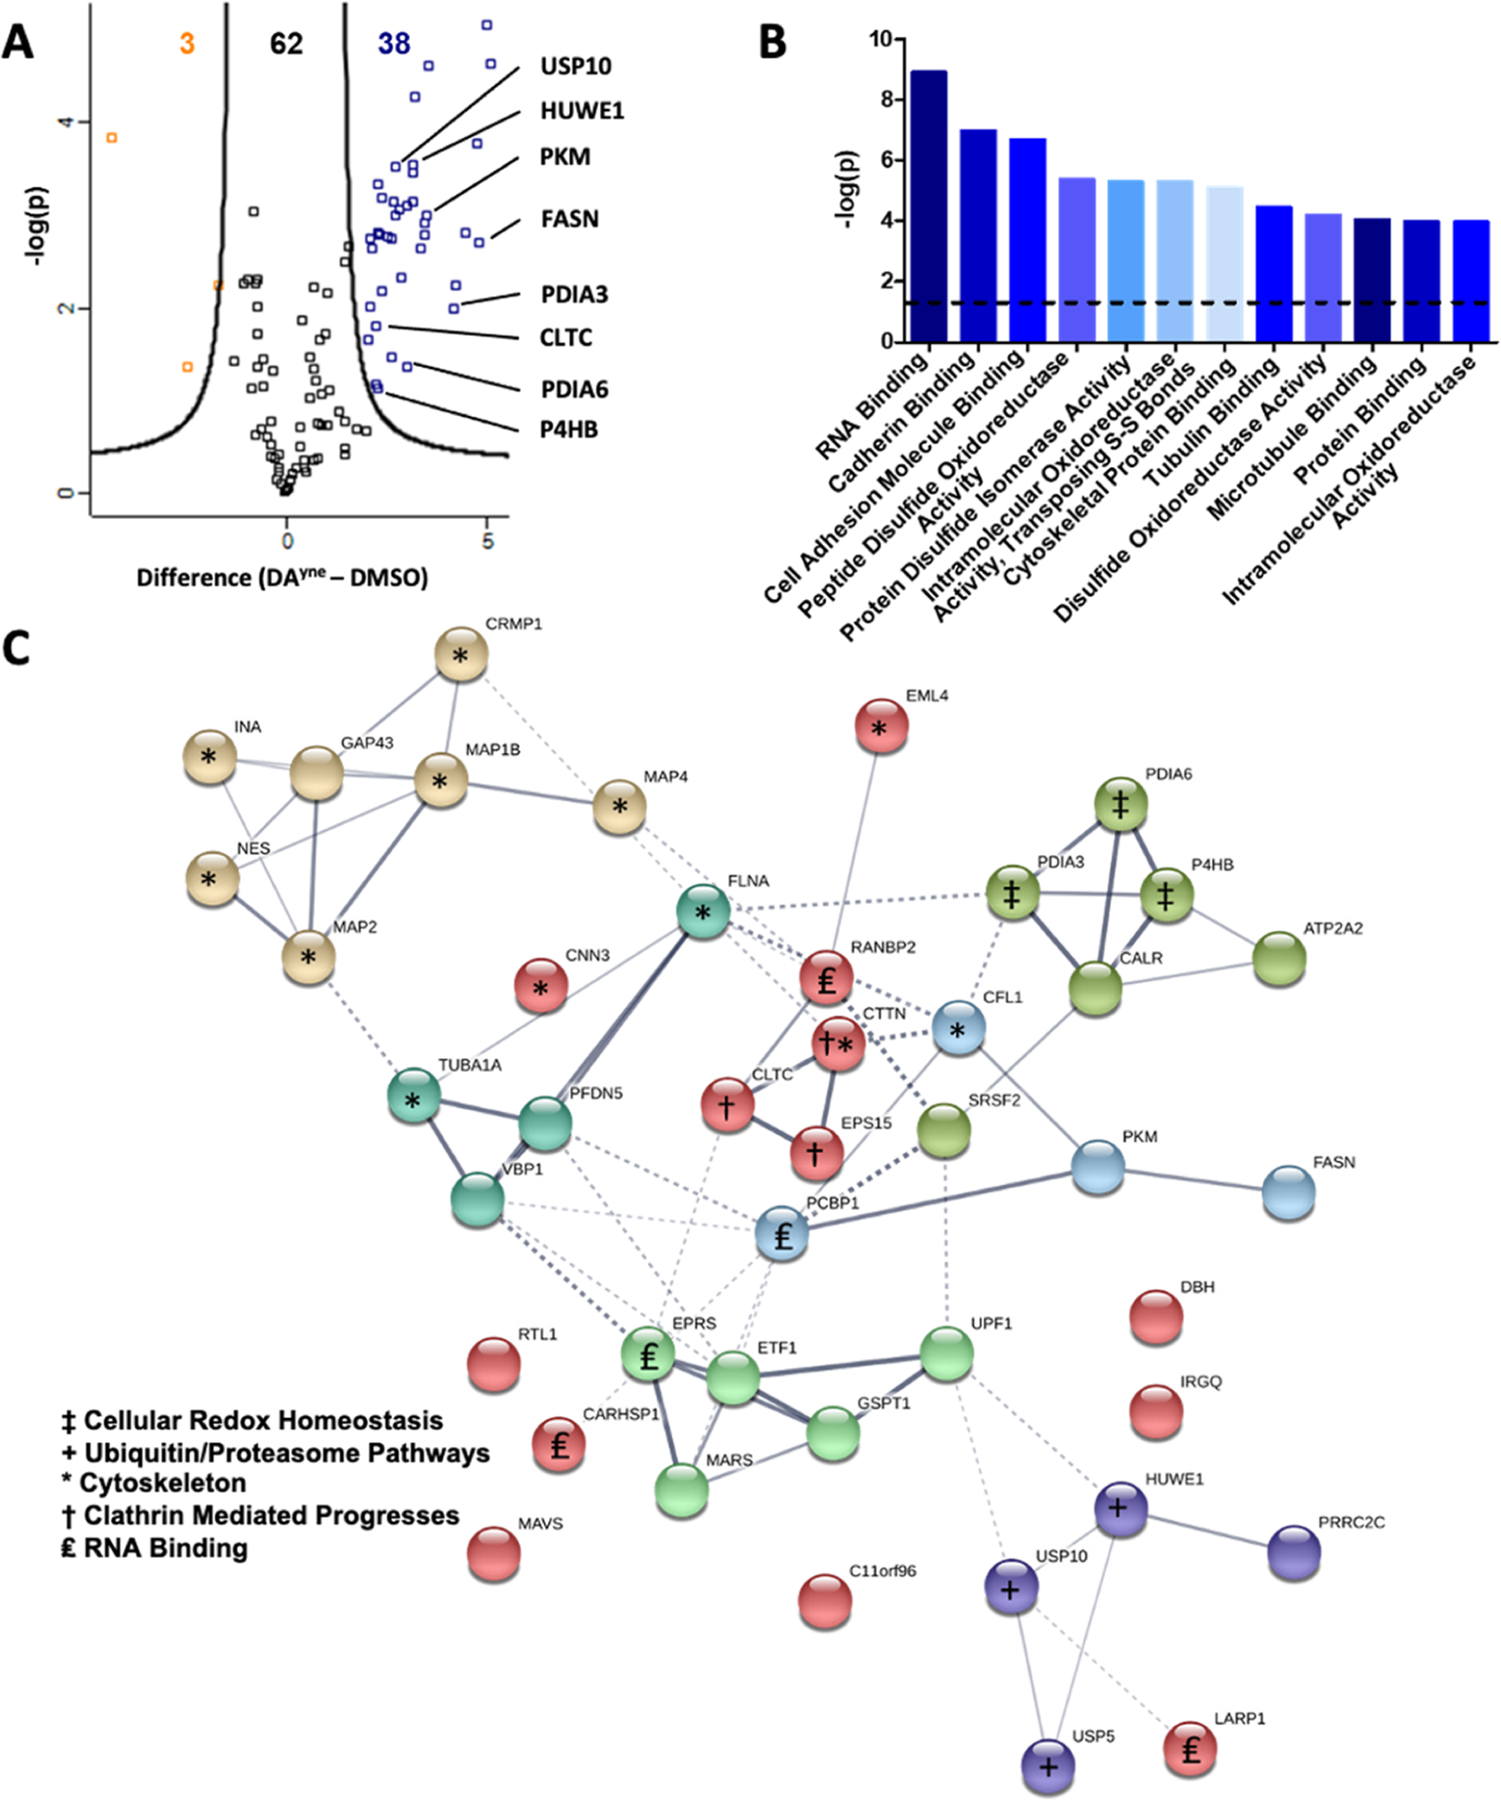
Figure 6.

Proteomic enrichment and bioinformatic analysis of DPAs. (A) Volcano plot for quantitative analysis of proteins identified following 12 h treatment of SH-SY5Y cells with DMSO or 10 μM DAyne and enrichment at a FDR of 0.05 and a minimal coefficient of variation (S0) of 2.0. Proteins highlighted in orange or blue were significantly enriched in the DMSO or DAyne treatment, respectively. Data are representative of 3 biological replicates from each treatment condition. (B) Molecular function of DAyne enriched proteins. Analysis performed with PANTHER overrepresentation test (released 20190711); annotation version: GO Ontology database (released 20190703), using Fisher’s exact test with FDR correction. The dashed line represents a statistical cutoff of p = 0.05. (C) Pathway analysis of DAyne enriched proteins was performed with the STRING (Search Tool for the Retrieve of Interacting Genes, version 11) database. Confidence of interaction represented by line thickness. Proteins involved in enriched processes are labeled.
