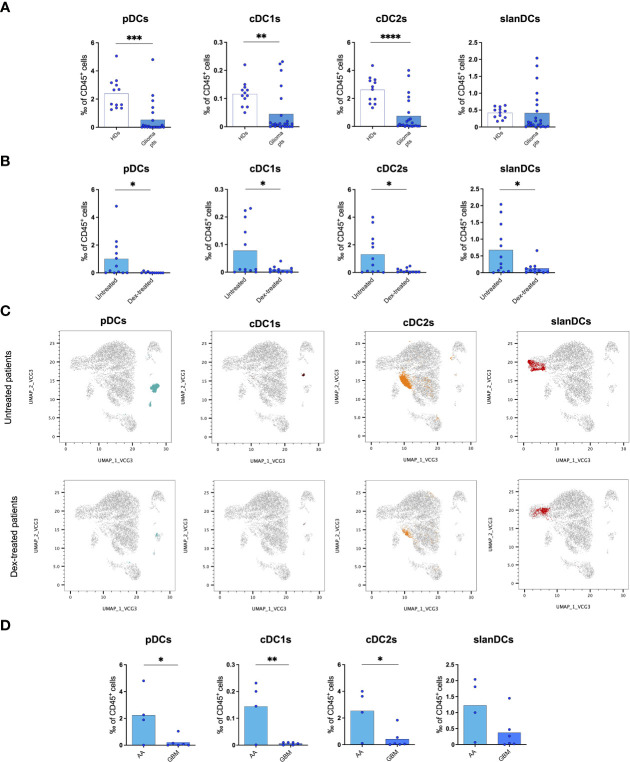
Figure 1.
Flow cytometric analysis of PBDC subsets showing a reduction of circulating DCs in glioma patients. (A) Frequency of PBDC subsets in healthy donors (HDs, n=12) and glioma patients (Glioma pts, n=23). (B) Frequency of PBDC subsets in glioma patients either untreated (Untreated, n=12) or treated with dexamethasone (Dex-treated, n=11). Data expressed as per-thousand (‰) of CD45+ cells. Each symbol represents a single sample. In each series, the mean is shown. *p<0.05, **p<0.01, ***p<0.001, ****p<0.0001, calculated using the t-test. (C) UMAP plots showing the clustering of PBDC subsets in untreated and dex-treated glioma patients. Each plot shows a single DC subset as identified with manual gating strategy. Viable circulating CD45+/lin−/HLA-DR+ cells of down-sampled, concatenated files obtained from all glioma patients are shown in gray. pDCs are highlighted in dark turquoise, cDC1s in brown, cDC2s in orange, slanDCs in red. (D) Frequency of PBDC subsets in untreated IDH-wildtype glioma patients stratified based on histopathological diagnosis (anaplastic astrocytoma: AA, n=4; glioblastoma: GBM, n=6).

