Figure 3.
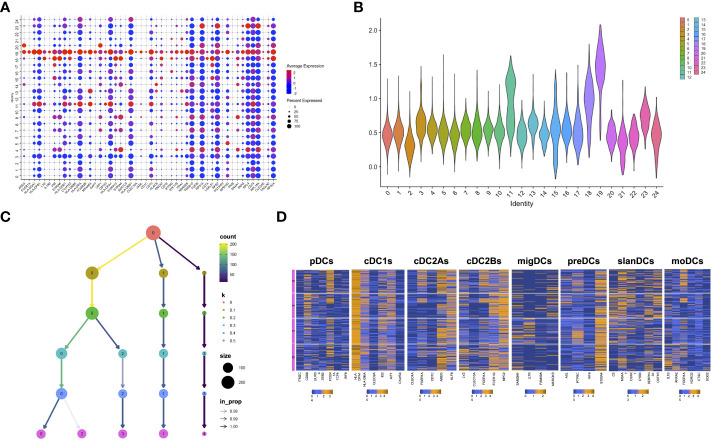
scRNAseq confirms the presence and heterogeneity of TIDCs. (A) Dot plot showing the first 50 DEGs (padj<0.05) between cluster 19 and all the other clusters that compose CD45+ cells obtained from 7 tumor tissues and 2 healthy brain tissues from 8 glioma patients. All 50 genes are known to be enriched or expressed by human DCs, thus indicating that cluster 19 is the cluster of DCs. Color scale indicates the average expression level of genes; dot size indicates the percentage of gene-expressing cells in each cluster. (B) By applying the AddModuleScore function that allows to compare the expression of a specific set of genes among clusters, the expression of the 50-gene signature characterizing cluster 19 was visualized in a violin plot. (C) Reclustering of cluster 19 represented in a clustering tree based on kk-means. Nodes colored according to the value of k and sized according to the number of cells they represent. Edges colored according to the number of cells (from blue representing few to yellow representing many). Cluster labels are randomly assigned by the kk-means algorithm. (D) Heatmaps showing the mean expression of genes characteristic of pDCs, cDC1s, cDC2As, cDC2Bs, preDCs, migDCs, slanDCs, and moDCs, in clusters from 0 to 3 at resolution 0.5. Expression values are zero-centered and scaled for each gene. Each gene name is reported on the bottom of each heatmap.

