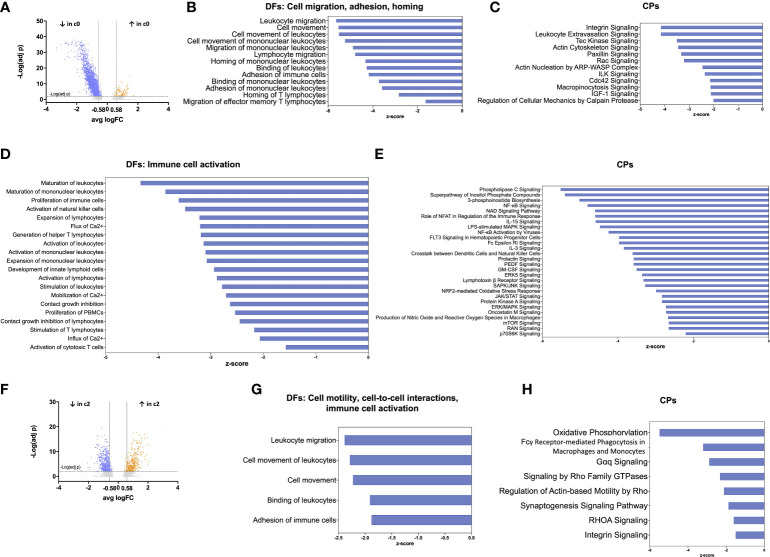
Figure 4.
Functional annotation of TIDC clusters by IPA analysis reveals impairment of the largest cluster of DCs. (A) Volcano plot showing DEGs between cluster 0 (the largest cluster of TIDCs) and cluster 1, at resolution 0.3. Grey dots indicate genes that were not statistically significant (padj>0.01); orange dots indicate significantly up-regulated genes (with log2FC>0.58), and blue dots indicate significantly down-regulated genes (with log2FC<-0.58). (B) Bar plot showing DFs of sub-categories related to cell migration, adhesion and homing that were significantly down-regulated in cluster 0 compared with cluster 1. (C) Bar plot showing CPs related to DFs shown in b that were significantly down-regulated in cluster 0 compared with cluster 1. (D) Bar plot showing DFs related to immune cell activation that were significantly down-regulated in cluster 0 compared with cluster 1. (E) Bar plots showing CPs related to DFs shown in D that were significantly down-regulated in cluster 0 compared with cluster 1. (F) Volcano plot showing DEGs between cluster 2 (mostly composed of cells deriving from dex-treated patients) and cluster 0, at resolution 0.3. Grey dots indicate genes that were not statistically significant (padj>0.01); orange dots indicate significantly up-regulated genes (with log2FC>0.58), and blue dots indicate significantly down-regulated genes (with log2FC<-0.58). (G) Bar plot showing DFs of sub-categories related to cell motility, cell-to-cell interactions, and immune cell activation that were significantly down-regulated in cluster 2 compared with cluster 0. (H) Bar plots showing CPs related to DFs shown in G that were significantly down-regulated in cluster 2 compared with cluster 0. In all the bar plots, the functions or pathways, listed on the left side of the plot, are ranked according to the z-score that predicts a down-regulation (blue, z-score <-1.5).

